


📘 This post is part of the ebook: Automating Financial Planning, Reporting & Analysis in Excel
Read the full Table of Contents: Automating Financial Planning, Reporting & Analysis in Excel
⬅️ Previous Chapter: Chapter 2: Manual Excel Workflows: Pain Points and Smart Fixes
➡️ Next Chapter: Chapter 4: The Budgeting Process — From Numbers to Buy-In

Introduction
Every finance team eventually hits a wall. As businesses grow, the lack of a centralized financial system becomes clear — spreadsheets slow down, formulas break, and reconciliation deadlines stretch longer each month.
It’s not Excel’s fault. It’s how it’s being used.
The real problem is the lack of a centralized financial system — one that unifies all data, automation, and reporting into a single, trusted architecture.
The answer isn’t to abandon Excel; it’s to redefine its role inside a modern centralized financial system, where Excel remains the calculation and presentation layer connected to a secure data source.
The Shift from Chaos to Control
In most organizations, Excel starts out small — a budget file here, a forecast there — and gradually evolves into an interconnected web of linked workbooks.
At first, it works fine. But soon enough, you begin noticing symptoms of spreadsheet overload:
- Files take minutes to open
- Formulas break unpredictably
- Version chaos spreads across departments
- Financial closes take longer every month
This is the tipping point — where finance must move from spreadsheets to systems.
You don’t stop using Excel. You rebuild how Excel fits into the architecture.
In this new model, Excel becomes a calculation and visualization layer sitting neatly on top of a centralized financial database — your single source of truth.
Step 1: Redefine Excel’s Role
In traditional workflows, Excel tries to do everything:
- Data entry
- Data storage
- Calculation engine
- Reporting dashboard
That’s too much responsibility for one tool.
When we separate those functions, each part of the system thrives — and Excel becomes faster, cleaner, and easier to manage.
| Function | Ideal Tool | Why It Works |
|---|---|---|
| Data Storage | Database (SQL, MongoDB, Data Warehouse) | Centralizes and secures all financial data in one place. |
| Data Transformation | ETL tools / Power Query / Automation scripts | Cleans and prepares structured data for analysis. |
| Calculation & Modeling | Excel | Fast, transparent, and user-controlled environment. |
| Visualization & Reporting | Excel / Power BI | Flexible, familiar dashboards for business users. |
Once Excel is freed from storing data, it performs better and becomes far more reliable for analysis and decision-making.
Step 2: Create a Central Financial Database for Your Centralized Financial System
A centralized financial database (or data cube) is the backbone of modern FP&A automation.
It houses all critical financial and operational data — including trial balances, budgets, actuals, departments, customers, products, and time periods — in a structured, relational format.
Benefits of a Centralized Database:
- Every report draws from the same dataset
- No duplication or conflicting versions
- Instant access for all connected workbooks
- Easy to scale as your organization grows
Once this data cube is in place, you can build reporting templates in Excel that pull the exact data needed for each report — instantly and accurately.
Step 3: Connect Excel to the Centralized Financial System Database
Now comes the integration layer — connecting Excel to your centralized database.
You can use several tools and methods, depending on your setup:
- Power Query or ODBC connectors for live imports
- PivotXL or similar Excel add-ins that read and write to cubes
- Custom APIs or scripts to sync budgets, actuals, and forecasts
Once connected, Excel can both pull and push data:
- Pull: Retrieve live actuals, budgets, or prior forecasts
- Push: Submit new budgets or updated scenarios back into the database
Now, your finance team doesn’t need to open 20 linked files to refresh reports.
A simple “Refresh All” brings every report up to date in seconds.
Result:
Excel becomes a front-end interface for entry, analysis, and visualization — while the database ensures consistency, control, and data integrity.
Step 4: Build Reusable Templates for a Centralized Financial System
Once your architecture is in place, standardization becomes simple and powerful.
You can design reusable templates for:
- Profit & Loss (P&L) statements
- Balance Sheets and Cash Flow reports
- Budget vs. Actual comparisons
- Variance Analysis reports
- Rolling Forecast models
Each template connects directly to dimensions in your financial cube — such as Entity, Department, Account, Scenario, or Time Period.
That means when you add a new month or department, your models instantly adapt — no rewriting formulas, no creating new files.
This is how you scale automation without losing flexibility.
Step 5: Control Access and Collaboration
Centralized data naturally leads to better governance and collaboration.
Here’s how it helps:
- Each user accesses only the data relevant to their department.
- Every change is logged, making audits simple.
- Teams no longer rely on endless email attachments — reports connect to live data sources.
You get the security and structure of a centralized system while keeping the user-friendly experience of Excel.
In essence, this reduces spreadsheet risk while preserving Excel’s flexibility.
The Outcome: Excel as the Interface in a Centralized Financial System
When implemented correctly, the transformation feels seamless:
- Finance professionals still use Excel daily.
- Reports look and behave the same.
- But behind the scenes, everything is structured, automated, and connected.
You’re no longer managing spreadsheets — you’re managing a financial ecosystem powered by Excel.
This is the future of financial planning and reporting — automation built on control, not chaos.
Visual: How Automated FP&A Architecture Works
Below is a simple diagram you can include in your blog or ebook to visualize the flow of modern financial architecture.
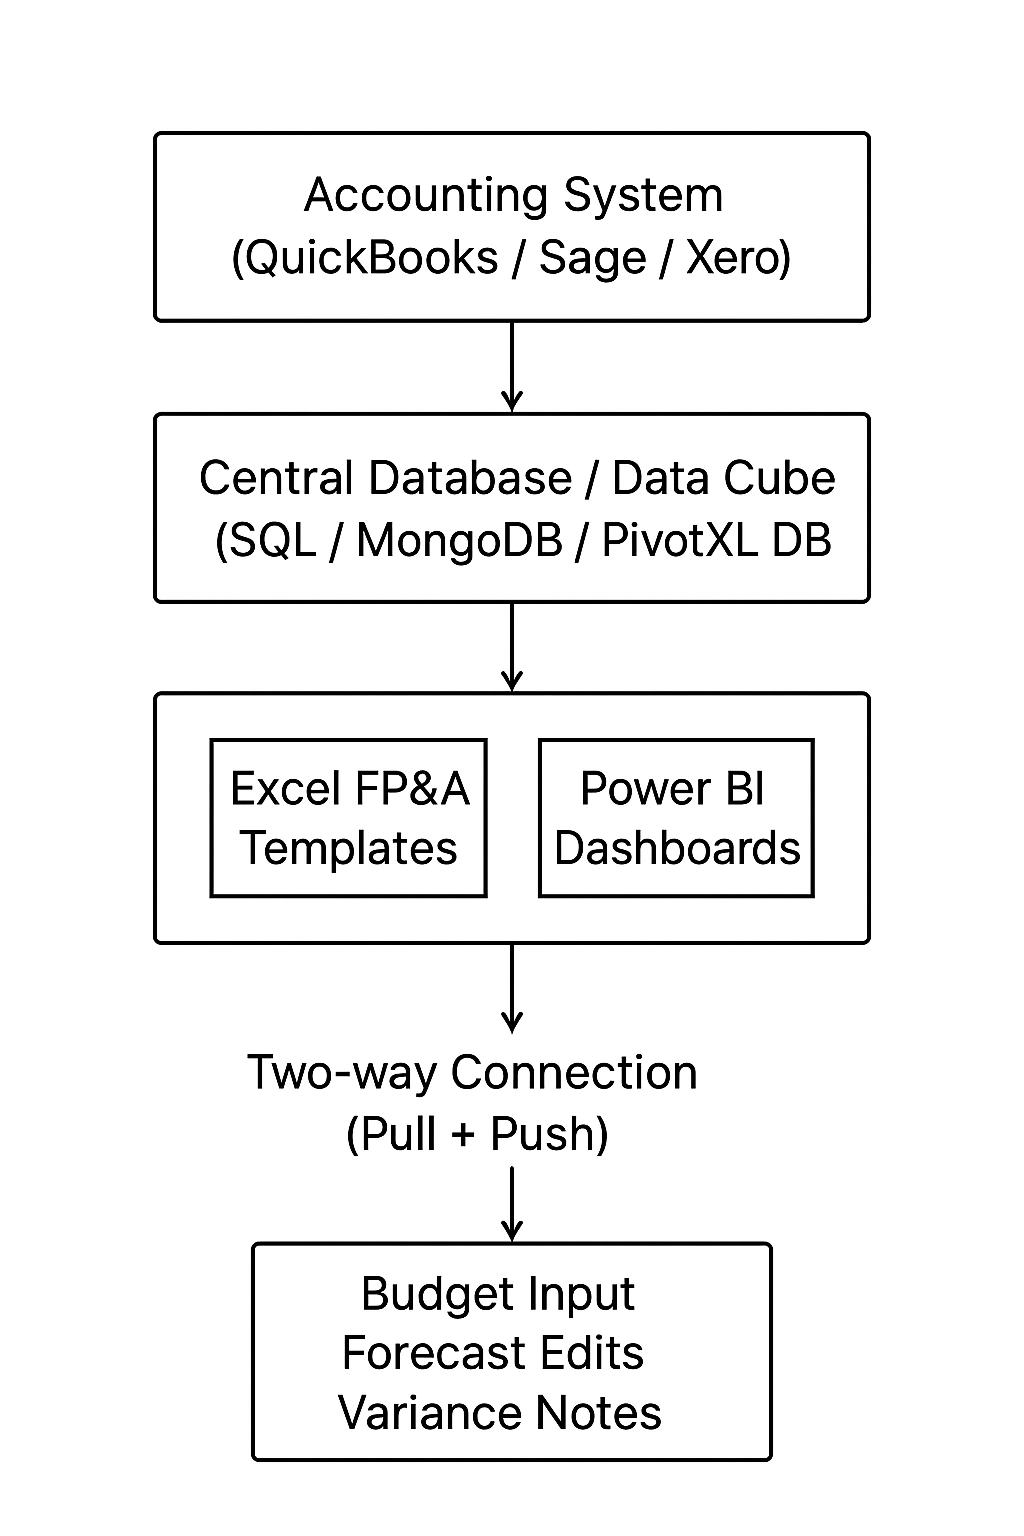
Figure Caption:
Excel as the Interface, Not the System
Excel connects directly to a central database or cube, replacing fragile file links with secure, refreshable connections.
Dashboards, reports, and forecasts update automatically from a single shared dataset — ensuring real-time accuracy and consistency.
Key Takeaway: Why Every Business Needs a Centralized Financial System
Moving from spreadsheets to systems isn’t about replacing Excel — it’s about anchoring it to a strong, centralized foundation.
When your financial data lives in a database and Excel connects as a smart, dynamic interface, automation becomes effortless.
This shift gives you:
- Reliable, real-time reporting
- Fewer manual updates
- Scalable models that grow with your business
- Consistency across every department
Excel remains your everyday tool — but now, it’s supported by an architecture designed for accuracy, speed, and collaboration.
Conclusion
The evolution from scattered spreadsheets to a centralized financial system is one of the most impactful transformations a finance team can make.
It eliminates chaos, strengthens control, and unlocks automation without sacrificing Excel’s flexibility.
By combining a centralized database with connected Excel templates, finance teams can finally focus on analysis and strategy instead of endless data wrangling.
In the next chapter, we’ll explore how this foundation enables automated financial planning — including driver-based budgeting and scenario modeling — turning Excel into a living, breathing model of your business.

