


📘 This post is part of the ebook: Automating Financial Planning, Reporting & Analysis in Excel
Read the full Table of Contents: Automating Financial Planning, Reporting & Analysis in Excel
⬅️ Previous Chapter: Chapter 4: The Budgeting Process — From Numbers to Buy-In
➡️ Next Chapter: Chapter 6: Automating Financial Analysis in Excel
Introduction: Turning Data Into Insight
Finance teams spend hours every month compiling, cleaning, and formatting data. Automating financial reporting in Excel eliminates this manual burden.
By linking Excel directly to accounting systems and automating mapping logic, reports like P&L, Balance Sheet, and Cash Flow refresh automatically — transforming Excel into a real-time financial insight hub instead of a manual reporting tool.
The Manual Process of Financial Reporting in Excel
Before automation, finance professionals follow a tedious workflow:
- Export a trial balance from the accounting system.
- Manually map accounts to Revenue, COGS, and Expenses.
- Build formulas like
SUMIFSorVLOOKUPto roll up data. - Create templates for each financial statement.
- Repeat the entire process monthly.
This manual financial reporting process in Excel is slow, error-prone, and leaves less time for meaningful financial analysis.
Why Automating Financial Reporting in Excel Matters
Automating financial reporting in Excel delivers faster, more accurate, and consistent results.
| Problem | Automation Benefit |
|---|---|
| Manual data imports | Direct data connection to accounting system |
| Inconsistent mapping | Centralized chart of accounts logic |
| Broken formulas | Reusable, system-driven rollups |
| Delayed updates | One-click real-time refresh |
| Version confusion | Shared, live data reports |
With automation, reports that once took days can update instantly with a single click.
How Automating Financial Reporting in Excel Works
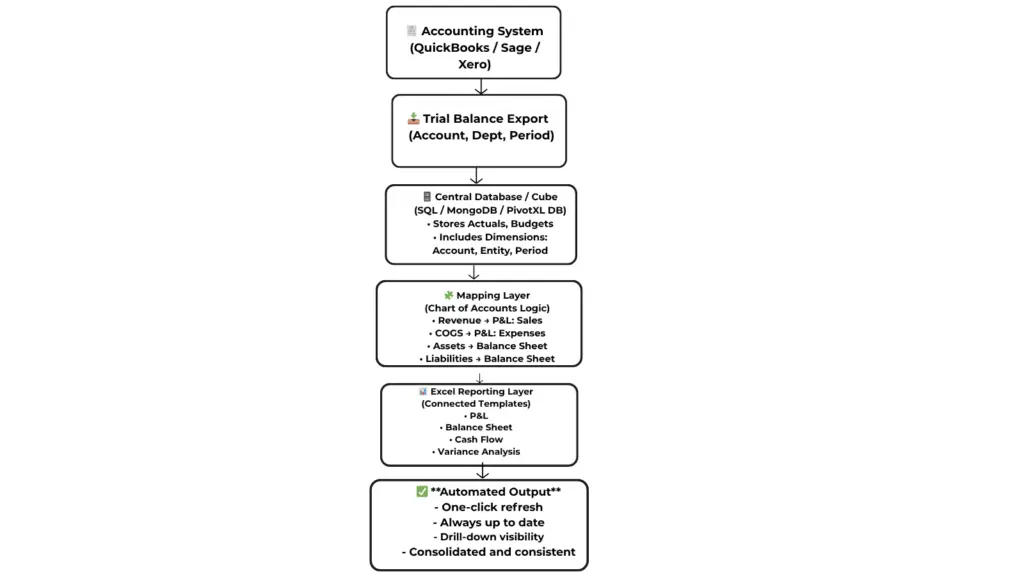
Automated reporting in Excel relies on three key layers:
1. Data Source Layer
Connect your accounting system (e.g., QuickBooks, Sage, Xero, or NetSuite) to a central database or data cube that stores financial data by dimensions such as:
- Account
- Department
- Entity
- Time (Month, Quarter, Year)
- Scenario (Actual, Budget, Forecast)
This becomes your single source of truth.
2. Mapping Layer
Each account is mapped to a financial statement line (Revenue, COGS, Assets, Liabilities, etc.).
Once defined, this mapping is reused automatically — even when new accounts are added.
3. Presentation Layer (Excel)
Excel connects to the database, pulling in aggregated data automatically.
Reports like P&L, Balance Sheet, and Cash Flow update dynamically when filters (Month, Department, Scenario) change — no manual entry required.
Example: Automating the Profit & Loss (P&L) Report in Excel
Here’s how an automated P&L process works:
- Import trial balance data from your accounting system.
- Map accounts to chart of account categories.
- Aggregate totals by month, department, and scenario in the cube.
- Excel templates pull live totals and calculate metrics (Gross Profit, EBITDA, Net Profit).
- Refresh the data — and your reports update instantly.
Add extra dimensions (customer, product, region) for deep insights — without rebuilding any formulas.
Multi-Entity Financial Reporting Automation in Excel
Automation simplifies multi-entity financial consolidation — often one of the most time-consuming processes in finance.
- Each subsidiary’s trial balance flows into the central cube.
- Currency conversion and intercompany eliminations occur automatically.
- Excel retrieves consolidated results just like a single entity report.
No more merging 20 spreadsheets — just one unified, refreshable report.
Why Excel Is Still the Best Financial Reporting Tool
Even in a world of modern BI platforms, Excel remains the preferred interface for financial reporting.
- Familiar: Everyone knows Excel.
- Flexible: Easily tailor reports for management, boards, or auditors.
- Traceable: Drill down into transactions anytime.
Automation doesn’t replace Excel — it elevates it into a dynamic, data-driven reporting platform.
Key Takeaway
Automating financial reporting in Excel bridges the gap between accounting and analysis.
By connecting Excel to live data and structured mappings, finance teams can:
- Eliminate repetitive manual work
- Ensure data accuracy and consistency
- Spend more time on forecasting and decision-making
Your reports become living documents — always accurate, always up to date.
What’s Next: Automating Financial Analysis
In the next chapter, we’ll explore how to build on automated reporting by introducing automated financial analysis — enabling you to track ratios, KPIs, and trends that explain why performance changes, not just what changed.
Diagram: How Automated Financial Reporting in Excel Works
Key Takeaway: Real-Time Insights Through Automation
Automating financial reporting in Excel bridges the gap between data entry and decision-making.
It helps finance teams:
- Eliminate repetitive manual tasks
- Ensure consistent, error-free reports
- Focus on forecasting and analysis
Your reports become living dashboards — always accurate and up to date.
Conclusion: Transform Excel Into a Real-Time Financial Intelligence Hub
In today’s dynamic finance environment, manual reporting is no longer sustainable.
Automating financial reporting in Excel empowers finance teams to convert raw data into actionable insights — without leaving the familiar Excel interface.
By connecting your accounting system directly to Excel:
- Eliminate manual imports and mapping errors
- Consolidate across entities and currencies
- Create reusable, refreshable reports (P&L, Balance Sheet, Cash Flow)
- Gain real-time performance visibility
Tools like PivotXL extend Excel’s capabilities — adding live data connections, mapping logic, and consolidation automation.
👉 Start your journey toward automating financial reporting in Excel today with PivotXL — and turn your spreadsheets into a true financial intelligence hub.

