


The Time dimension in PivotXL is a specialized tool for performing temporal data analysis with unique features that set it apart from other dimensions. It allows users to define fixed periods like “January 2023” or “December 2023,” making it ideal for precise analyses. Additionally, it supports relative time adjustments, such as “previous month” or “next month,” which automatically adapt to the current date for continuous insights.
Users can configure YearTo definitions with start and closing months, including multiple setups for fiscal and calendar years. These definitions enable the automatic calculation of key metrics like Year-to-Date (YTD), Year-to-Go (YTG), quarterly breakdowns (Q1, Q2, Q3, Q4), and the End of Year. By incorporating both static and dynamic timeframes, the Time dimension ensures flexibility and precision in managing temporal data, making it a powerful tool for advanced analysis.
What You Will Learn in This Post
In this detailed post, you will gain valuable insights into working with the Time Dimension in PivotXL, including advanced features and their practical applications. Specifically, you will learn:
- How to Create and Configure Specialized Time Dimensions
- Understand how to define fixed periods (e.g., January 2023) and relative time periods (e.g., previous month) for versatile temporal data analysis.
- Learn to configure multiple “YearTo” setups for fiscal and calendar years.
- How to Automatically Calculate Year-to-Date (YTD) and Year-to-Go (YTG) Metrics
- Explore how to set start and end months for accurate YTD, YTG, and quarterly metric calculations.
- Discover how these metrics adapt to previous years for comparative analysis.
- How to Map the Time Dimension to Excel
- Learn to map individual or bulk Excel cells to data cubes, ensuring seamless integration and dynamic data updates.
- Gain insights into best practices for managing mapped cells and maintaining links to the database when editing Excel sheets.
By the end of this post, you’ll have the knowledge to configure time-based dimensions, integrate them with Excel, and leverage PivotXL’s powerful tools for advanced temporal data analysis and reporting.
Key Features of the Time Dimension
Absolute Time
- Defines specific time periods (e.g., “January 2023,” “December 2023”).
- Useful for analyses requiring fixed and precise timeframes.
Relative Time
- Dynamically adjusts based on the current date (e.g., “previous month,” “next month”).
- Ideal for rolling or continuous analyses without manual updates.
YearTo – Definition
- Allows setting parameters like:
- Start Month.
- Closing Month (defaults to Relative Time -1). Note: the current month is considered as 0, -1 as the previous month, +1 as the next month, and other months are determined similarly.
- Multiple YearTo configurations can be defined to accommodate different start and end months, such as for a fiscal year or a calendar year.
- The Previous Year can also be specified to support various calculations.
YearTo Metrics
Once the YearTo definitions are made – the following metrics are automatically calculated
- Enables mapping of key time-based metrics:
- YTD (Year-to-Date).
- YTG (Year-to-Go).
- Quarterly Metrics: Q1, Q2, Q3, Q4.
- End of Year
- The above metrics can also be applied to other previously defined years.
Adding Time Dimension To Data Cube
Time is a specialized dimension in PivotXL, offering advanced capabilities for managing temporal data. Within the Time dimension.
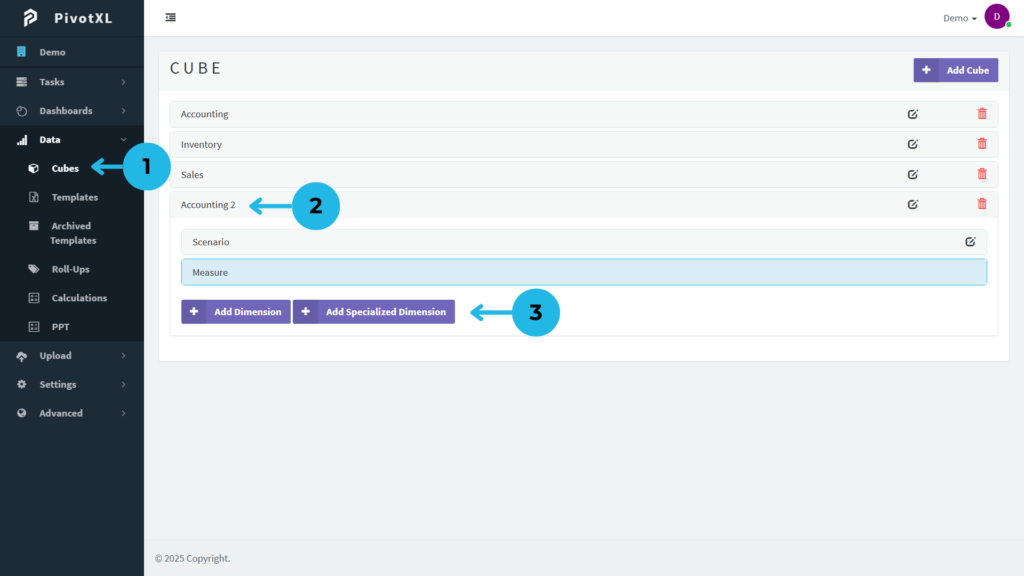
- Log in to PivotXL – Access the PivotXL web app, navigate to the Data menu, and select the Cube submenu.
- Choose a Cube – Select a cube where you want to add a specialized dimension.
- Add a Specialized Dimension – Click the “Add Specialized Dimension” button.
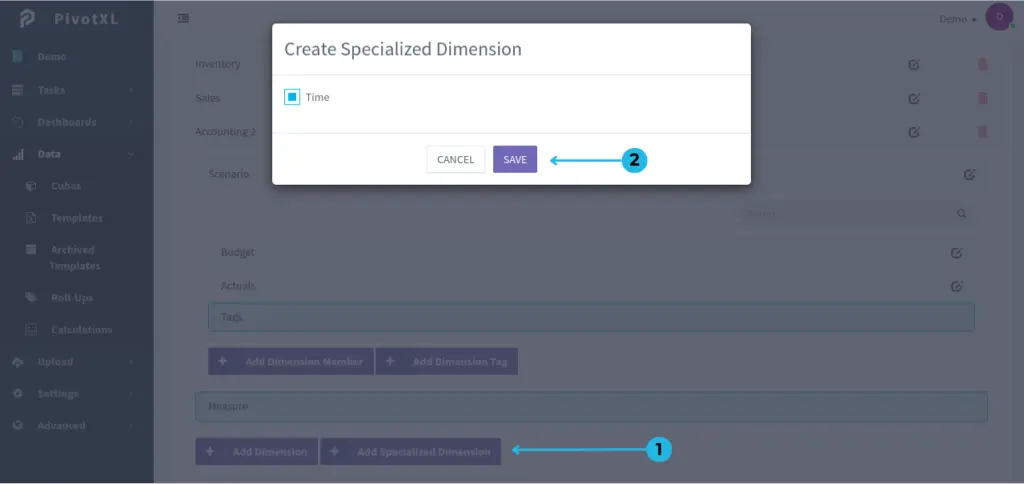
- After clicking the “Add Specialized Dimension” button, a pop-up window will appear.
- The “Time” option is selected by default in the pop-up. Simply click the “Save” button to add the specialized time dimension to the cube.
Above, we explored adding a time dimension to a cube. Now, we will explore its ‘YearTo’ setup further.
Configuring YearTo Setup for Time Dimension
Many organizations often need to generate YTD (Year-to-Date) and YTG (Year-to-Go) metrics that align with different fiscal start and end months. PivotXL simplifies this process. In the following section, we’ll walk through the steps to set it up.
We’ll configure two “YearTo” metrics: one for the Calendar Year and another for the Financial Year. Each YTD and YTG calculation will be based on customizable start and end months defined within the system.
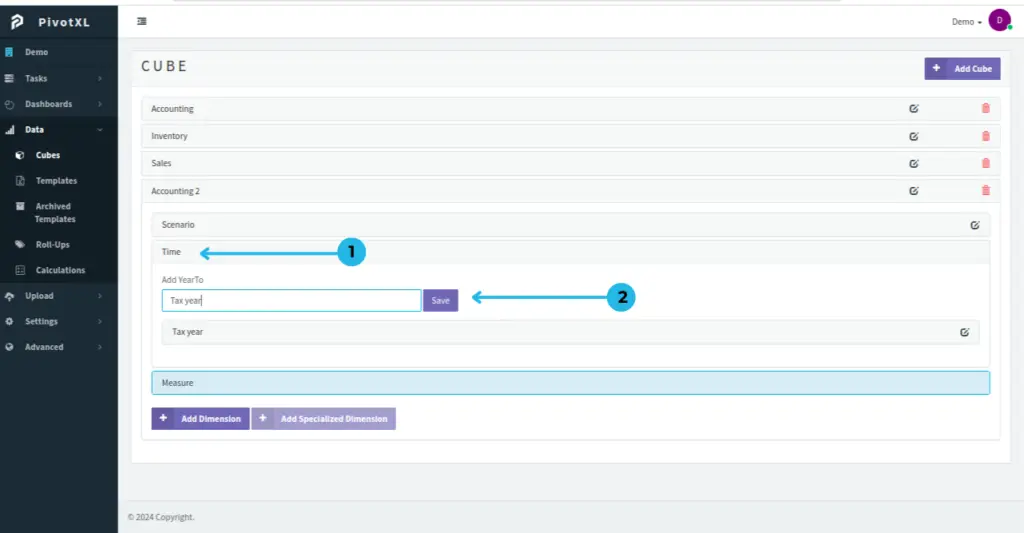
- Click on ‘Time,’ and under it, you will see ‘Add Year To.’
- In the dropdown, add the name and click ‘Save’ button.
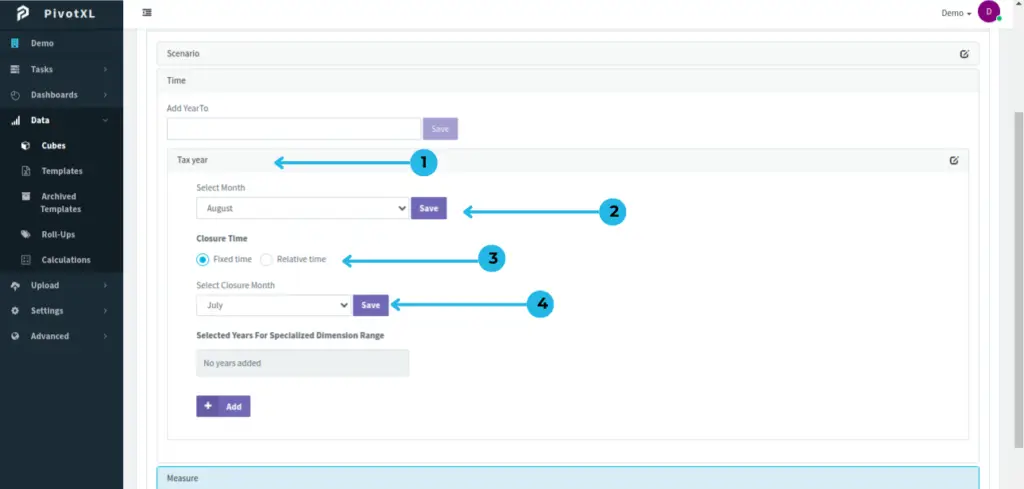
- Click on ‘Tax Year’,it will display the Tax Year settings.
- Select the starting month of your Financial Year and click the Save button.
- Closure month: Choose either Fixed Time or Relative Time based on your needs.
- Select the closure month of your Financial Year and click the Save button again. Your selection (Fixed Time or Relative Time) will be saved under the name ‘Tax Year.’
Calculating YTD and YTG for Previous Years
In some scenarios, you may need to compare the current Year-to-Date (YTD) metrics with YTD metrics from previous years. To facilitate this comparison, you can configure the system to calculate YTD and Year-to-Go (YTG) metrics for specific past years.
To do this, you will need to define the years for which you want the YTD and YTG numbers. This setup ensures that you can seamlessly access and analyze historical data alongside current metrics, enabling better trend analysis and decision-making. The system allows you to manage these configurations easily, providing flexibility in your reporting needs.
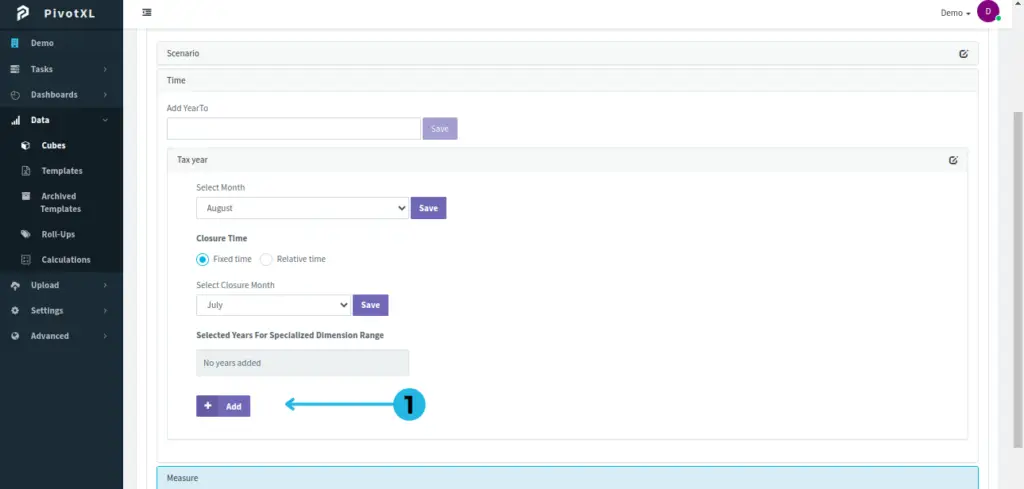
- Click the Add button to select years for the Specialized Dimension Range.
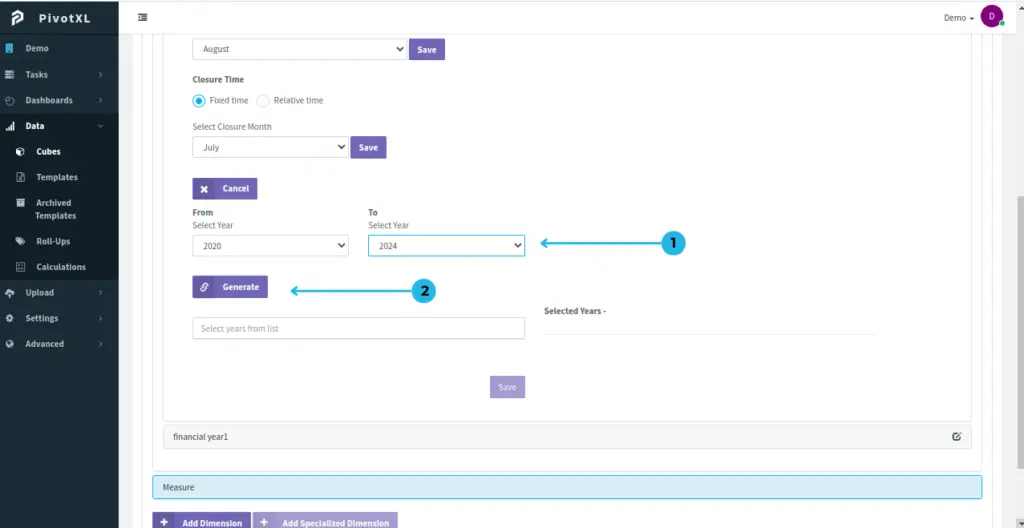
- Select the year in ‘From’ and ‘To. ‘Note: You can view the old data for the selected year.
- Now, click the Generate button.
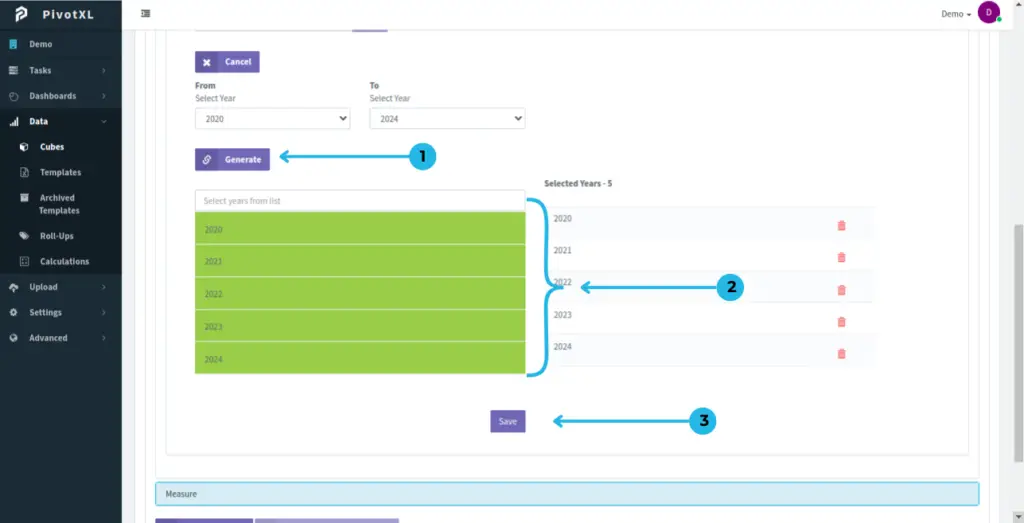
- After clicking the Generate button, you can see the generated years.
- Select the years you want.
- Click the Save button to save your selections.
After Adding the Tax year YTD, YTG, Q1, Q2, Q3, Q4, End Of Year can be used in both web app and excel side.
Detailed explanation for Year-to-Date (YTD), Year-to-Go (YTG), Q1, Q2, Q3, Q4, and End of Year (EOY):
Consider the starting month as January, the closing month as March, and the ending month as December, following the concepts of YTD,YTG,Q1,Q2,Q3,Q4,End Of Year.
Year-to-Date (YTD)
- Definition: YTD represents the cumulative value of a metric (such as revenue, expenses, or performance) from the beginning of the year up to the Closure month.
- Purpose: It is used to track progress and compare performance over the same period in previous years.
- Example: If the year starts in January and Closure month is March, YTD will sum all data from January to March.
Year-to-Go (YTG)
- Definition: YTG refers to the remaining value or period left in the year from the Closure month to the end of the year.
- Purpose: It helps in forecasting and planning by focusing on what is yet to happen or be achieved.
- Example: If Closure month is March, YTG will calculate the data from April to December.
Q1 (First Quarter)
- Definition: Q1 represents the first quarter of the year, typically spanning from January to March.
- Purpose: Used to measure performance or progress during the first three months of the year.
- Example: Revenue for Q1 includes data from January, February, and March.
Q2 (Second Quarter)
- Definition: Q2 represents the second quarter of the year, typically spanning from April to June.
- Purpose: Used to track performance for the second three months of the year.
- Example: Expenses for Q2 include data from April, May, and June.
Q3 (Third Quarter)
- Definition: Q3 represents the third quarter of the year, typically spanning from July to September.
- Purpose: Helps assess mid-to-late year performance, covering summer or peak seasons in some industries.
- Example: Sales for Q3 include data from July, August, and September.
Q4 (Fourth Quarter)
- Definition: Q4 represents the fourth quarter of the year, typically spanning from October to December.
- Purpose: This is the final quarter, crucial for year-end reporting, analysis, and meeting annual targets.
- Example: Profit for Q4 includes data from October, November, and December.
End of Year (EOY)
- Definition: EOY encompasses the entire calendar or fiscal year, summarizing all data from January to December.
- Purpose: It provides a comprehensive view of yearly performance and is essential for annual reporting, closing accounts, and strategic planning.
- Example: Total revenue for the EOY includes data from all four quarters.
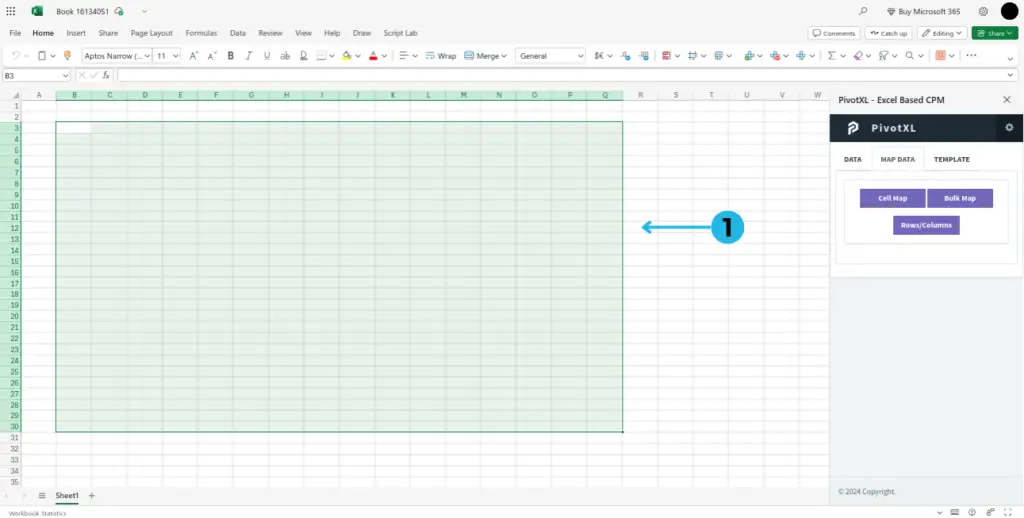
Mapping Time Dimension With Excel
Now let us understand step by step process of using Specialized dimension in excel side cell map.
Explanation of Cube Combination Mapping
Cube Combination Mapping refers to the process of mapping dimensions and measures from a data cube to specific excel cell. This method is particularly useful when working with multidimensional data, as it allows users to configure and extract the exact data combinations they need for analysis.
Cell Map Usage:
- To map a single cell.
- To check the mapped cells.
- To delete a mapped cell.
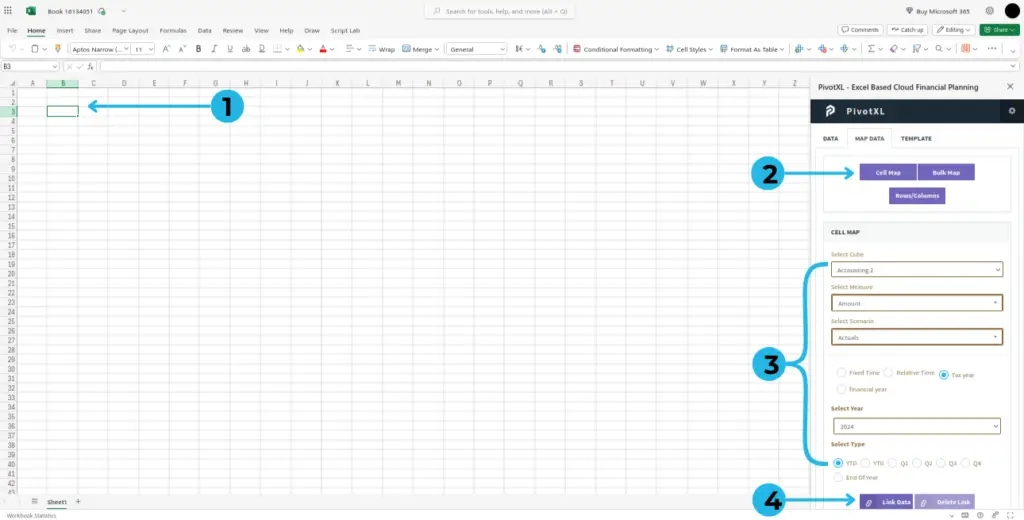
Mapping of one single cell:
- Click on the cell you need to map.
- Click on the Cell Map button,A list of items to select will appear.
- Select the cube and fill in all the fields.
- Click the Link Data button to save.
Explanation of Bulk Map
Bulk Map is a feature used to map multiple data cells at once to a cube. This is particularly useful in scenarios where you are working with large-scale data, such as financial reports and need to quickly link multiple parts of your document to corresponding data cube.
- Select the range to use bulk map.

- Click the Bulk Map button. A pop-up page will open.
- Select the cube you want.
- Select the Dimension for the row. for example Scenario as row.
- Select the Dimension for the column. for example Specialized dimension as column.
- Use the Filter by Tags dropdown to select the desired options (for row).
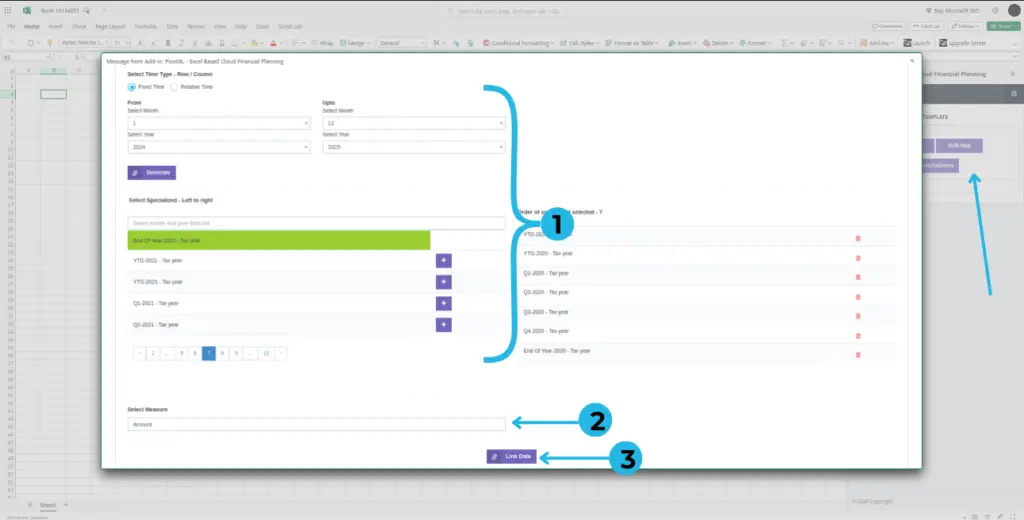
- Select the Time Type you want and click the Generate button and select the months range (for column).
- Next, select the Measure.
- Finally, click the Link Data button to save.
Back to Table of Contents

