


Introduction:
Standard deviation with excel is a key statistical measure that helps analyze the spread or dispersion of a data set. If you’re working with data in Excel, calculating standard deviation is quick and straightforward. In this beginner-friendly tutorial, we will guide you step by step on how to calculate using built-in functions.
What is Standard Deviation?
Standard deviation is a key statistical measure that helps determine how much individual data points deviate from the mean (average) of a dataset.
- When the standard deviation is low, it means that most data points are closely clustered around the mean, indicating greater consistency in the dataset.
- On the other hand, when the standard deviation is high, it suggests that the values are more spread out, showing greater variability and potential fluctuations.
Types of Standard Deviation:
- STDEV.S – This function is used for sample data, making it the most common choice in business and research scenarios where analyzing a subset of data is necessary.
- STDEV.P – On the other hand, this function is designed for population data, meaning it should be used when you have access to the entire dataset.
In most practical situations, STDEV.S is the preferred function, as working with samples is more common than having complete population data. By selecting the right function, you can ensure more accurate and meaningful results in your analysis!
How to Calculate Standard Deviation in Excel:
Follow these simple steps to calculate:
1: Enter Your Data
- Open an Excel spreadsheet.
- Input your data in a single column (e.g., A1:A10). Example dataset:
2: Select a Blank Cell for the Formula
- Click on an empty cell where you want to display the standard deviation result.
3: Use the Standard Deviation Function
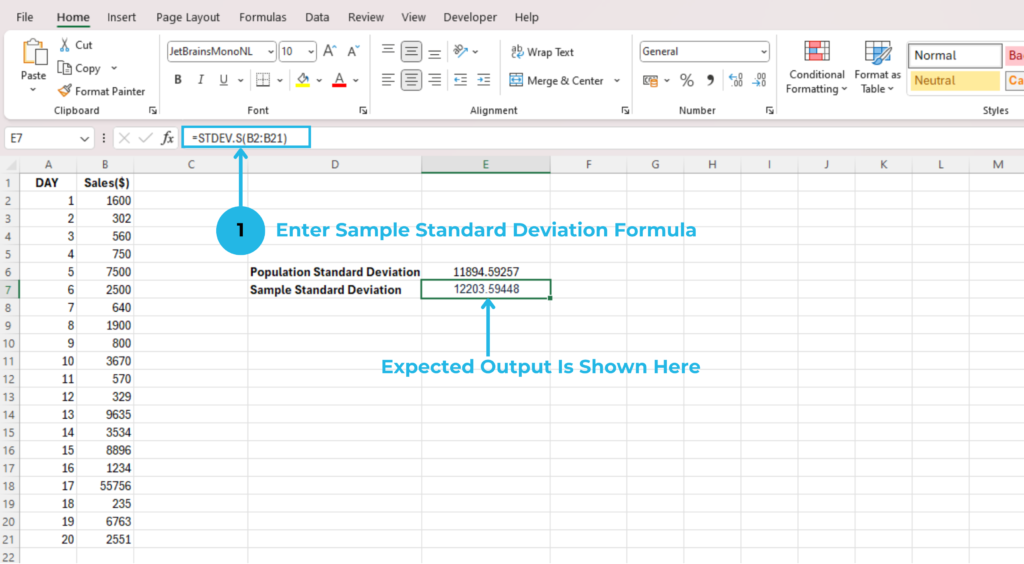
- For sample data, enter the formula:
=STDEV.S(A1:A10)
- For population data, enter:
=STDEV.P(A1:A10)
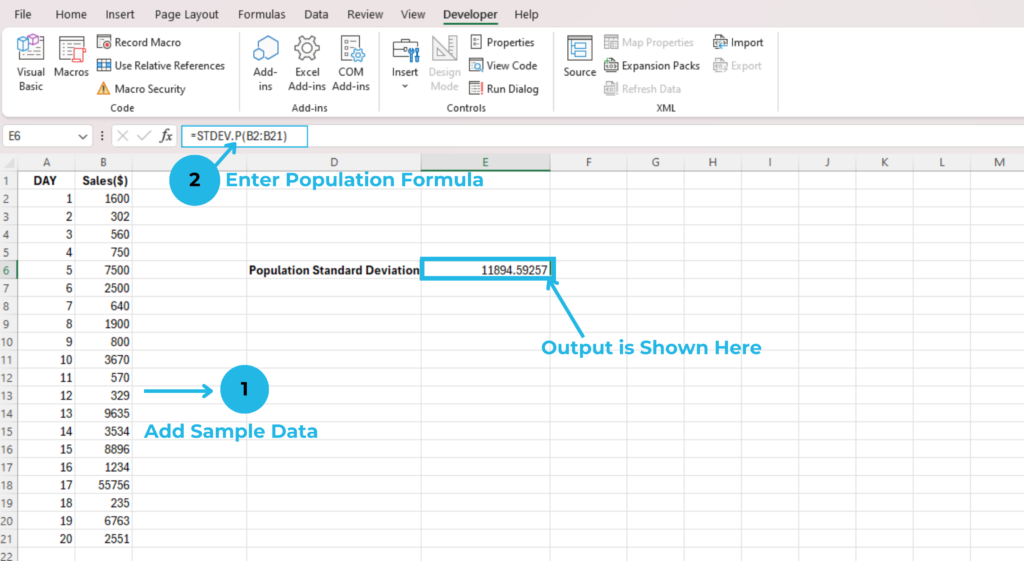
We used the STDEV.P() function because, in our scenario, our entire population for the analysis is the sales data for the last month.
- Press Enter, and Excel will return the standard deviation value.
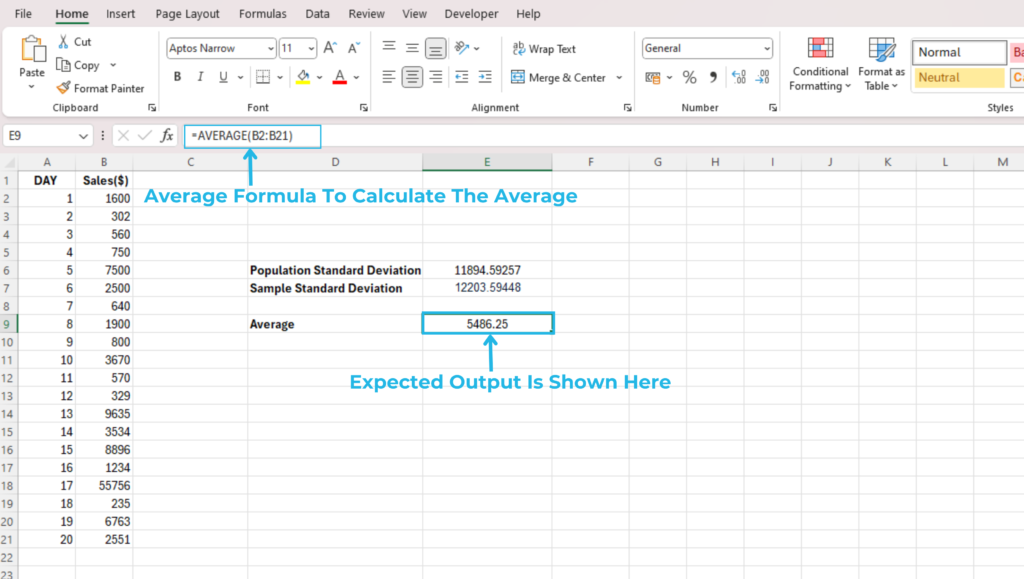
Verify the Result
Excel instantly calculates the standard deviation. To double-check, you can use the AVERAGE function to find the mean and see how much individual values deviate.
Practical Applications of Standard Deviation:
- Business Analysis – It plays a key role in measuring sales performance fluctuations, helping businesses track revenue trends and identify seasonal patterns.
- Finance – Investors and analysts use it for assessing stock market volatility, which helps in making informed trading decisions.
- Quality Control – In manufacturing, it is essential for checking consistency in production processes, ensuring that products meet quality standards.
- Education – Educators and researchers rely on it for analyzing student performance variations, helping to evaluate learning outcomes and improve teaching strategies.
By applying standard deviation in these areas, professionals can make more data-driven decisions and enhance overall efficiency!
Tips for Accurate Calculations:
- When working with sample data, it’s best to use STDEV.S, as it is the most commonly used standard deviation function in Excel.
- Before calculating, make sure to double-check your data range to avoid any empty or incorrect values that could affect the accuracy of your results. Taking a moment to review your selection can save time and prevent errors.
- Once you’ve calculated the standard deviation, consider formatting the result cells for better readability. Rounding the values to two decimal places ensures clarity, making your analysis easier to interpret.
By following these steps, you can improve both the accuracy and presentation of your data!
Conclusion:
Calculating standard deviation becomes effortless with Excel’s built-in functions like STDEV.S and STDEV.P. Whether you’re analyzing financial trends, business performance, or scientific data, Excel provides a simple yet powerful way to measure data variability.Now that you understand how to use these functions, why not try them with your own dataset? This will not only reinforce your learning but also help you enhance your analytical skills.
For more useful tutorials and tips, visit our website – PIVOTXL!
