Financial modeling is more than just building projections. It’s about creating a dynamic system that can flex with your business, guide decisions, and continuously compare forecasted assumptions with actual results. While Excel has long been the preferred tool for financial modeling, the way you structure your models—especially when real-world data starts coming in—makes all the difference. Hence you need the right Financial Modeling Tools in Excel as an add-in to help with data management, build modular models and avoid bloat.
In this post, we’ll explore:
- What financial models are used for
- Why analysis doesn’t stop at the model
- Common pitfalls in Excel-based models
- How PivotXL helps break down and centralize your modelling process
- How to connect your model to actuals and forecast continuously
What Are Financial Models Used For?
Financial models serve as a quantitative blueprint for how your business will perform in the future. They’re used for:
- Budgeting annual revenues and costs
- Planning headcount and operating expenses
- Forecasting cash flows, debt servicing, or runway
- Scenario analysis (e.g., best case vs worst case)
- Investment analysis and decision-making
These models help finance teams ask “what if?”—what if we hire 10 more people? What if COGS drops 5%? What if we lose a major client?
But a model, no matter how well-designed, is still a hypothesis. The real value emerges when you test that hypothesis against reality.
The Model Is Just the Beginning
Once you start tracking actual performance, the model’s purpose evolves. You want to see:
- Where did we deviate from plan?
- Were our assumptions accurate?
- Are we over- or under-performing by segment, product, or geography?
This is where many finance teams hit roadblocks.
Because unless your chart of accounts and model outputs are designed to speak the same language, comparing actuals to forecast is clunky, error-prone, or downright impossible. Here’s why:
Problem 1: Chart of Accounts Doesn’t Match the Model
Most general ledgers (QuickBooks, Sage, NetSuite) evolve organically. Teams end up with:
- Redundant or misaligned GL accounts
- No clear segment mapping
- Inconsistent use of departments, classes, locations, or projects
So even if you have a model predicting payroll by department, your actuals may not be tagged that way. This creates a disconnect.
Solution? Either:
- Redesign your chart of accounts to align with the model’s assumptions (ideal but hard), or
- Perform roll-ups and allocations after importing your trial balance—matching actuals to modelled assumptions.
PivotXL supports both.
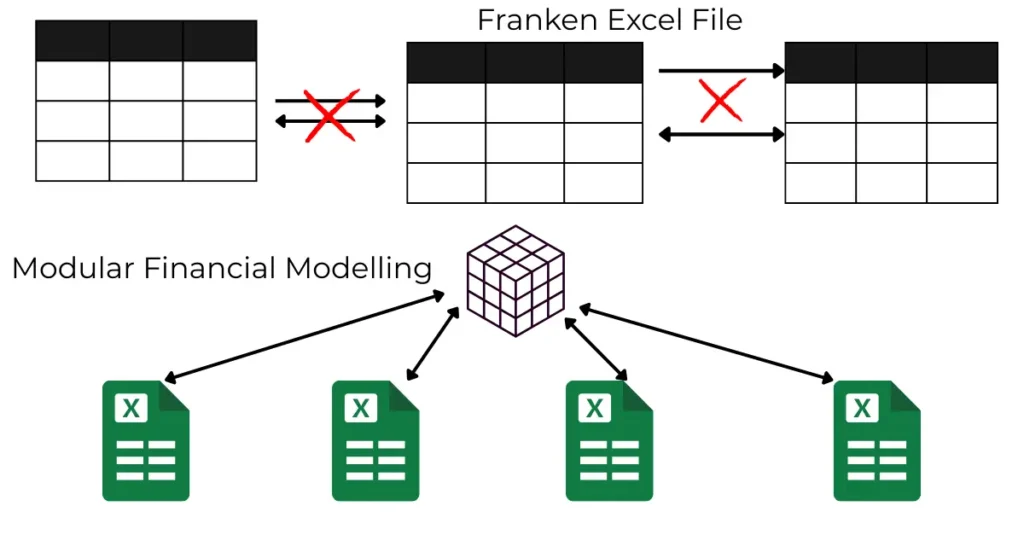
Problem 2: The Excel “Frankenfile”
Another common issue: financial models become enormous. One workbook with:
- 20+ linked tabs
- 1M+ cells of formulas
- Circular references and hidden sheets
- Links to other files that break when moved
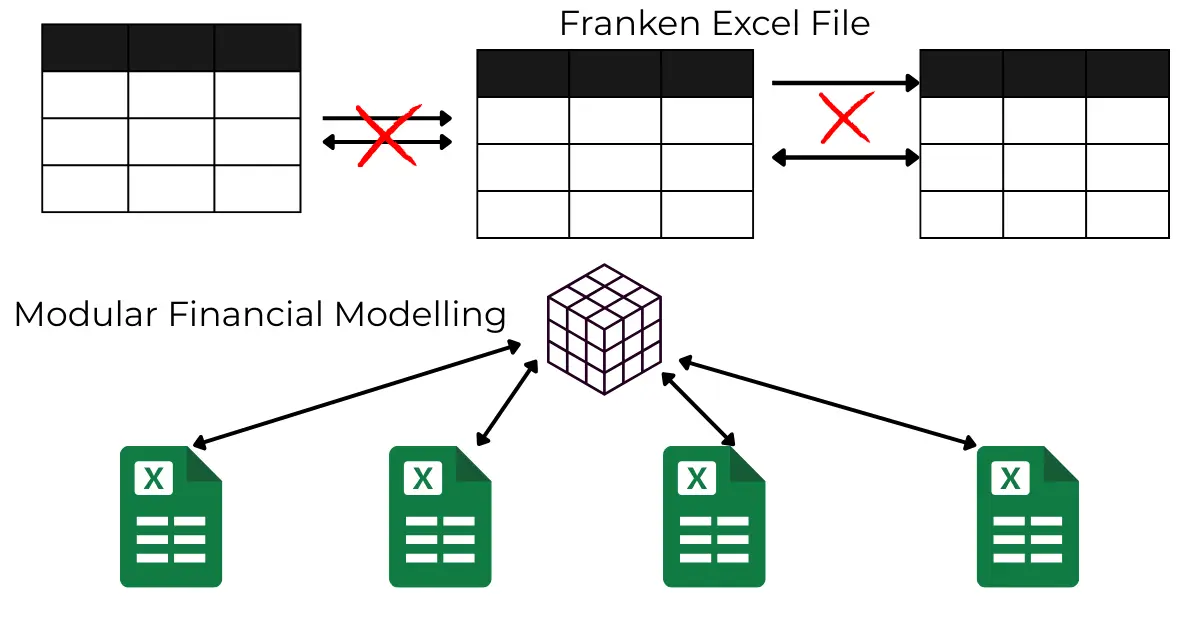
This “Frankenfile” problem is not just annoying—it’s a real risk. Updates become slow. Errors become invisible. And one broken formula can throw off the entire model.

The PivotXL Approach: Modular Models + Centralized Data
PivotXL is built to solve these issues while still working inside the familiar world of Excel. Here’s how:
1. Break the Model into Sub-Components
Instead of one giant workbook, you create multiple Excel files:
- A Revenue Driver file
- A Headcount Plan file
- A Marketing Spend file
- A Capex Schedule file
Each one models different line items and assumptions.
2. Centralize the Data in a Multi-Dimensional Database
These files don’t live in isolation. With PivotXL:
- Each file pushes its outputs to the same data cube
- The cube is structured using your chart of accounts and dimensions (e.g., department, location, time)
- The consolidated model is built automatically based on these sub-components
So you’re not “copy-pasting” numbers. You’re syncing clean outputs from modular models into a centralized financial structure.
From Modelling to Rolling Forecasts
Once your model is built in PivotXL, updating it becomes simple:
- Upload trial balance each month
- PivotXL allocates and rolls up the actuals to match the model
- Compare actuals vs forecast instantly using prebuilt dashboards or Excel templates
- Update key drivers (e.g., sales pipeline, hiring plans) and watch forecasted outputs adjust
No more copy-pasting. No more “version 8_final_final_REAL.xlsx”.
Benefits of Financial Modelling with PivotXL
- Modular, driver-based modelling instead of fragile megafiles
- Clean separation of actuals vs assumptions, automatically synced
- Dynamic scenario planning—change one driver and see its full P&L impact
- No more broken links or hidden errors
- Collaboration-ready—teams can work on separate models and feed into one truth
- Excel-native interface so your team doesn’t need to relearn a new tool
Ready to Level Up Your Modelling Game?
If you’re tired of bloated Excel workbooks, unreliable links, or messy actuals vs forecast comparisons, PivotXL might be the upgrade you’ve been looking for.
👉 Watch our free course on converting trial balance to financial statements
Related Reads:


