


Introduction
Horizontal Analysis in Excel is one of the most effective methods for evaluating financial performance over time. By comparing financial data—such as income, expenses, or assets—across multiple periods, you can uncover trends that reveal growth, efficiency, and areas needing improvement. This free Excel template helps you perform horizontal analysis quickly and accurately, without needing advanced accounting software.
Whether you’re an accountant, business analyst, or finance student, mastering Horizontal Analysis in Excel enables you to identify year-over-year changes and understand the “why” behind your numbers.
This comprehensive guide will teach you:
✅ What Horizontal Analysis means and why it matters
✅ How to calculate it step-by-step in Excel
✅ Real data examples (with ready formulas)
✅ Common interpretation tips
✅ Challenges to avoid
✅ A free downloadable Excel template
✅ How to automate this process using PivotXL
What is Horizontal Analysis?
Horizontal Analysis is a financial technique used to evaluate changes in specific financial statement items across two or more periods.
It shows how much a company’s performance has changed over time — both in absolute numbers and in percentages. This helps analysts and management identify long-term growth patterns, cost fluctuations, and performance shifts.
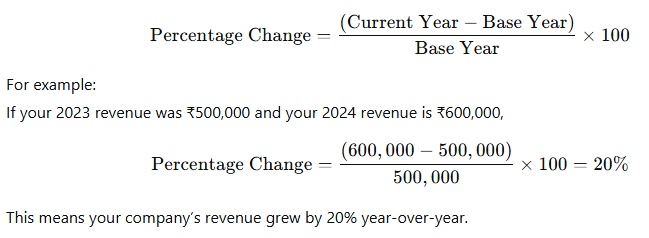
For example, comparing 2023 and 2024 profit statements shows whether revenue grew faster than expenses, revealing whether profitability improved.
Why Horizontal Analysis Matters
Horizontal Analysis isn’t just about comparing numbers — it’s about understanding performance trends and financial direction.
Here’s why it’s vital in modern financial management:
1. Trend Identification
Spot year-over-year growth or decline in key items like sales, operating income, or net profit. This helps identify whether your company is scaling efficiently or facing hidden issues.
2. Performance Evaluation
Compare the impact of management decisions — for example, if marketing spend increased 30%, did it lead to a similar rise in sales?
3. Expense Control
Identify fast-growing cost areas such as utilities or salaries that may need operational adjustments.
4. Forecasting Insights
Use historical trends to forecast future financial performance more accurately.
5. Investment Decision Support
Investors and financial analysts rely on horizontal analysis to judge a company’s consistency and long-term potential before investing.
Horizontal Analysis Example in Excel
Below is a real example of a Profit & Loss statement comparing two fiscal years (2023 and 2024):
| Category | 2023 (₹) | 2024 (₹) | Change (₹) | Change (%) |
|---|---|---|---|---|
| Revenue | 1,000,000 | 1,200,000 | 200,000 | 20.00% |
| Cost of Goods Sold (COGS) | 600,000 | 720,000 | 120,000 | 20.00% |
| Gross Profit | 400,000 | 480,000 | 80,000 | 20.00% |
| Operating Expenses | 150,000 | 170,000 | 20,000 | 13.33% |
| Salaries | 100,000 | 110,000 | 10,000 | 10.00% |
| Rent | 30,000 | 33,000 | 3,000 | 10.00% |
| Utilities | 20,000 | 27,000 | 7,000 | 35.00% |
| Net Income | 250,000 | 310,000 | 60,000 | 24.00% |
Excel Formulas Used:
- Change (₹):
=C2 - B2 - Change (%):
=(C2 - B2) / B2
These formulas automatically calculate both the absolute and percentage differences between years.
How to Perform Horizontal Analysis in Excel
Step 1: Prepare Your Data
Create a table with the following columns:
- Financial Category
- Base Year (2023)
- Current Year (2024)
- Change (₹)
- Change (%)
Step 2: Calculate the Variance
Use:
=C2 - B2
This shows the absolute change in Rupees between two years.
Step 3: Calculate Percentage Change
Use:
=(C2 - B2)/B2
Format this column as a percentage (Home → Number → Percentage).
Step 4: Apply Conditional Formatting
Highlight growth in green and declines in red to make patterns easier to visualize.
Step 5: Visualize with Charts
Create a Clustered Column Chart or Line Chart to show trends across major categories like Revenue, Gross Profit, and Net Income.
Interpreting the Example Results
Let’s analyze what the above table reveals:
- Revenue (+20%) – Excellent growth, likely due to increased sales or new clients.
- COGS (+20%) – Cost rise is in line with revenue, showing stable production efficiency.
- Gross Profit (+20%) – Indicates margin stability; business growth is healthy.
- Utilities (+35%) – Significant spike; may need cost-control measures.
- Net Income (+24%) – Profitability is improving faster than expenses — a positive trend.
This simple horizontal analysis shows that operational efficiency has remained solid while some expense categories need attention.
Horizontal vs. Vertical Analysis
| Aspect | Horizontal Analysis | Vertical Analysis |
|---|---|---|
| Focus | Change over time | Proportion within one period |
| Basis | Comparison across years | One year’s total (e.g., total revenue) |
| Purpose | Identify growth/decline trends | Assess cost structure & efficiency |
| Example | Revenue growth from 2023 to 2024 | COGS as % of revenue in 2024 |
Both analyses are complementary —
Horizontal Analysis shows time-based change,
while Vertical Analysis shows relationship-based structure.
Common Challenges in Horizontal Analysis
While useful, horizontal analysis can be misleading if you ignore certain factors:
- Inflation Impact:
Not adjusting for inflation can overstate or understate growth. - Accounting Policy Changes:
Changing accounting standards or classifications can distort comparisons. - Extraordinary Items:
One-time gains (like selling an asset) can falsely inflate profit growth. - Data Errors:
Manual entry can create incorrect trends — always use formula-driven templates. - Missing Context:
A high growth rate isn’t always positive if it’s due to short-term or unsustainable factors.
Automate Horizontal Analysis with PivotXL
Updating Excel reports manually every month or year can be slow and error-prone.
That’s why many finance teams now use PivotXL — an advanced automation and dashboard tool built to extend Excel’s capabilities.
Benefits of Automation with PivotXL:
- Real-time updates as financial data changes
- Multi-year dashboards to visualize 3–5 years of performance
- Dynamic variance tracking for Revenue, COGS, and Profit
- Error-free automation across linked statements
- Integration-ready with QuickBooks, Tally, or Zoho Books
💡 Instead of retyping or copying data, PivotXL automatically refreshes your trend analysis — so your management reports are always current.
What This Template Teaches
This Horizontal Analysis Excel Template helps you master analyzing year-over-year changes efficiently.
It automatically calculates both absolute and percentage variances across your financial categories — giving you instant insights into your company’s performance.
You’ll learn how to:
- Link financial data between years
- Apply variance formulas
- Identify expense overruns
- Build professional trend charts
- Highlight performance visually with formatting
Next Step: Automate It with PivotXL
While Excel is excellent for manual financial analysis, updating datasets frequently can be time-consuming and error-prone.
By automating these processes using PivotXL, you can ensure your analysis remains accurate and always up to date.
This enables finance teams, CFOs, and business owners to focus on strategy and insights, not data entry.
Download the Free Horizontal Analysis Template
Download Excel Template:
Includes:
- Real sample data (2023–2024)
- Formulas for Change and % Change
- Color-coded variance highlights
- Ready-to-use for Income Statements or Balance Sheets
Final Thoughts
Horizontal Analysis in Excel is one of the simplest yet most powerful financial tools available.
It transforms static reports into dynamic insights — allowing you to track performance, optimize spending, and make better business decisions.
By combining Excel formulas with automation tools like PivotXL, you can transform your finance department into a real-time performance engine — focusing on strategy rather than manual updates.
Related Articles
- Vertical Analysis in Excel – Free Template
- Budget vs Actual in Excel – Free Template
- Financial Ratios in Excel – Free Template
Book a Free Demo: Automate Excel Analysis with PivotXL
Want to save hours on manual Excel updates and reporting?
Our team can help automate your Horizontal, Vertical, and Ratio Analysis directly inside Excel.
👉 Book a Free Demo with PivotXL
Get customized dashboards, live templates, and expert automation for your business.

