


📘 This post is part of the ebook: Automating Financial Planning, Reporting & Analysis in Excel
Read the full Table of Contents: Automating Financial Planning, Reporting & Analysis in Excel
⬅️ Previous Chapter: Chapter 8: Automating Forecasting and Scenario Planning
➡️ Next Chapter: Chapter 10: Bringing It All Together — Designing Your Excel-Centered FP&A Automation System
Introduction
In today’s business world, KPI dashboards play a vital role in data-driven decision-making. From budgeting to forecasting, automation is reshaping how finance teams work. The ultimate goal isn’t just faster reporting — it’s achieving clear visibility and smarter decisions.
That’s where Key Performance Indicators (KPIs) come in. They convert complex financial data into visual insights that help leaders understand performance trends, identify issues, and make informed actions.
Why KPIs and Dashboards Matter
Dashboards bridge the gap between strategy and execution. They translate your company’s goals into measurable metrics, keeping teams aligned with key performance targets.
Here are some essential financial KPIs every FP&A (Financial Planning & Analysis) team should monitor:
| KPI | Formula | What It Shows |
|---|---|---|
| Gross Margin % | Gross Profit / Revenue | Profitability of operations |
| Operating Expense Ratio | Opex / Revenue | Cost efficiency |
| Current Ratio | Current Assets / Current Liabilities | Short-term liquidity |
| Accounts Receivable Days | (AR / Revenue) × 365 | Cash collection speed |
| Return on Capital Employed (ROCE) | EBITDA / Capital Employed | Efficiency of capital usage |
| Budget Variance % | (Actual – Budget) / Budget | Performance vs. plan |
Automating KPI calculations ensures real-time updates, fewer manual errors, and reliable insights for leadership decisions.
Building Dashboards in Excel
Excel remains one of the most flexible tools for building KPI Dashboards. With pivot tables, dynamic formulas, and powerful charting features, it’s perfect for financial modeling and analysis.
Benefits of Excel KPI Dashboards:
- Dynamic formulas and pivot tables
- Fully customizable layouts and formatting
- Seamless database connections
- Automatic monthly or daily refreshes
- Drill-downs by Department, Scenario, or Period
💡 When connected to a live data source, Excel KPI Dashboards become interactive analysis tools — not just spreadsheets
Web-Based Real-Time KPI Dashboards
While Excel handles modeling, web-based KPI Dashboards are essential for sharing insights and enabling collaboration.
Key Benefits of Web KPI Dashboards:
- Real-time updates and synchronization
- Accessible across devices (desktop, tablet, mobile)
- Notes and threaded discussions
- Role-based permissions and user access levels
- Audit trails and historical version control
🚀 Combining Excel with web-based KPI Dashboards ensures both flexibility and collaboration across teams.
Combining Excel and Web KPI Dashboards
Connecting both Excel and web dashboards to a single live database allows you to maximize productivity and accuracy.
| Feature | Excel KPI Dashboard | Web KPI Dashboard |
|---|---|---|
| Modeling Flexibility | ✅ Full formulas and pivot logic | ❌ Limited |
| Ease of Sharing | ⚠️ Manual unless automated | ✅ Real-time |
| Interactivity | ✅ Slicers, filters, macros | ✅ Comments, mobile access |
| Version Control | ⚠️ File-based | ✅ Database-driven |
| Collaboration | ⚠️ Prone to sharing errors | ✅ Centralized and tracked |
An integrated KPI Dashboard ecosystem ensures everyone sees one version of the truth.
The Role of Notes and Context
Numbers explain what is happening. Context explains why.
Every KPI should have:
- Notes explaining major variances
- Comments linked to specific metrics
- Task tracking for follow-up actions
Adding this context converts dashboards from static visuals into interactive decision logs — where collaboration meets analytics.
The Continuous KPI Dashboard Loop
When properly implemented, a KPI dashboard becomes a continuous feedback loop:
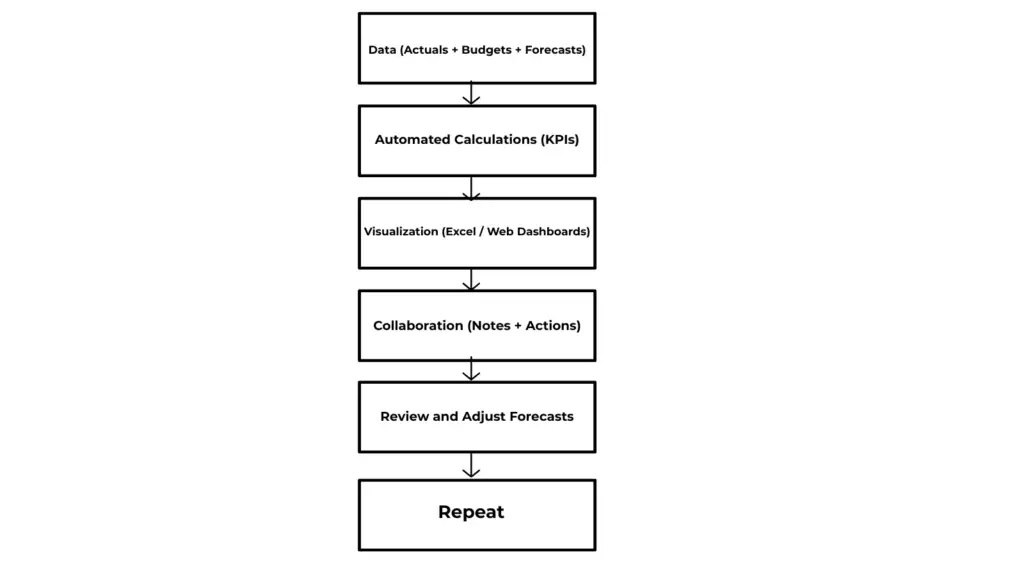
This loop turns financial reporting into a continuous process of learning and improvement.
Diagram: Integrated KPI and Dashboard System
Here’s a visual representation of how Excel and Web Dashboards connect to a single data source for unified, real-time insights:
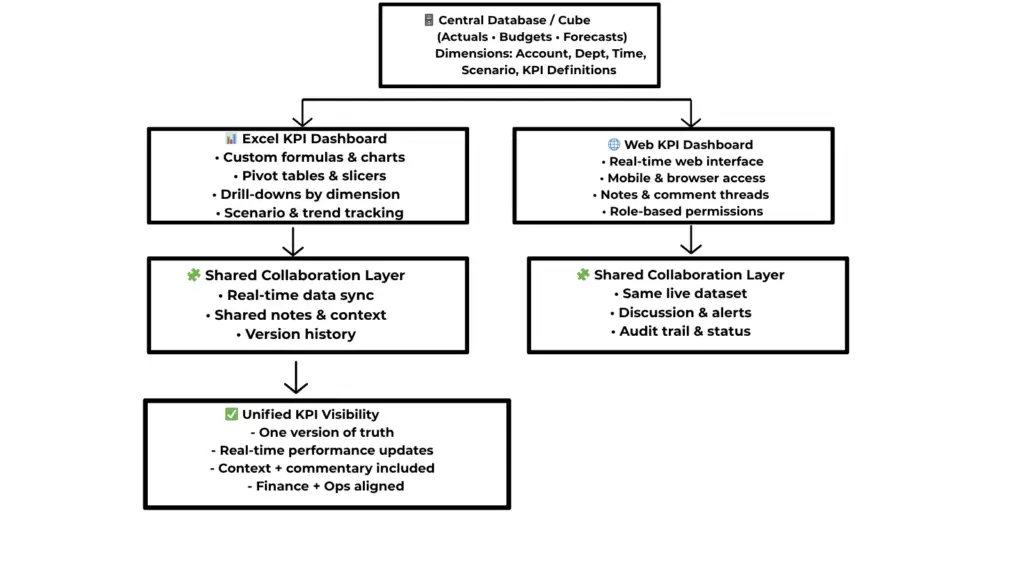
Integrating Excel and Web KPI Dashboards
Both dashboards connect to a centralized data source, ensuring consistent, real-time insights. Excel handles deep analysis, while web dashboards enable collaboration and visibility.
Conclusion: The Power of KPI Dashboards
KPI Dashboards are more than reporting tools — they are strategic instruments that bridge the gap between finance and management. When automated and integrated, KPI Dashboards empower organizations with real-time visibility, collaborative decision-making, consistent and accurate insights, and faster, smarter responses.
🎯 The goal isn’t just to report KPIs — it’s to make them actionable. With KPI Dashboards, every decision is data-backed, timely, and impactful.
To make this transformation seamless, tools like the PivotXL App simplify KPI Dashboard automation by connecting Excel models to live databases and web dashboards. This integration enables real-time updates, effortless collaboration, and accurate financial insights — turning traditional reporting into a powerful, data-driven decision system.

