


For most finance teams, Excel is still the go-to tool for preparing financial statements.
It’s flexible, customizable, and instantly familiar. But as your business grows, the manual work behind it—copying trial balances, mapping accounts, updating formulas—becomes a real bottleneck.
That’s where automating financial statements in Excel changes the game.
You get the flexibility of Excel without the tedious manual steps.
👉 Check out our FREE YouTube Course: Automating Trial Balance to Financial Statements in Excel with PivotXL (currently in progress!)
Why Automate Financial Statements in Excel?
- Save Time on Month-End Close
Stop spending hours on copy-paste and formula fixes. With automation, your statements update instantly when new data comes in. - Reduce Errors
Broken links, inconsistent mappings, and manual typos can derail the accuracy of your P&L and balance sheet. Automation ensures consistency across every reporting period. - Enable Faster Decision-Making
When statements are ready in minutes—not days—you can shift focus from preparing reports to analyzing results. - Reuse Mappings and Templates
Map your trial balance once, and use the same template every month or quarter.
The Manual vs. Automated Approach
| Step | Manual in Excel | Automated in Excel |
|---|---|---|
| Import trial balance | Copy-paste from accounting system | Pull directly into a multi-dimensional database |
| Map accounts to statements | SUMIFS / VLOOKUP every month | One-time roll-ups in the cube, reusable for any period |
| Prepare statements | Adjust ranges, fix formulas | Refresh data with a click in Excel |
| Consolidate entities | Merge files manually | Automatic consolidation in the cube |
| Final review | Multiple email iterations | Version-controlled in one file |
Related Read: Mapping Trial Balance to Financial Statements in Excel
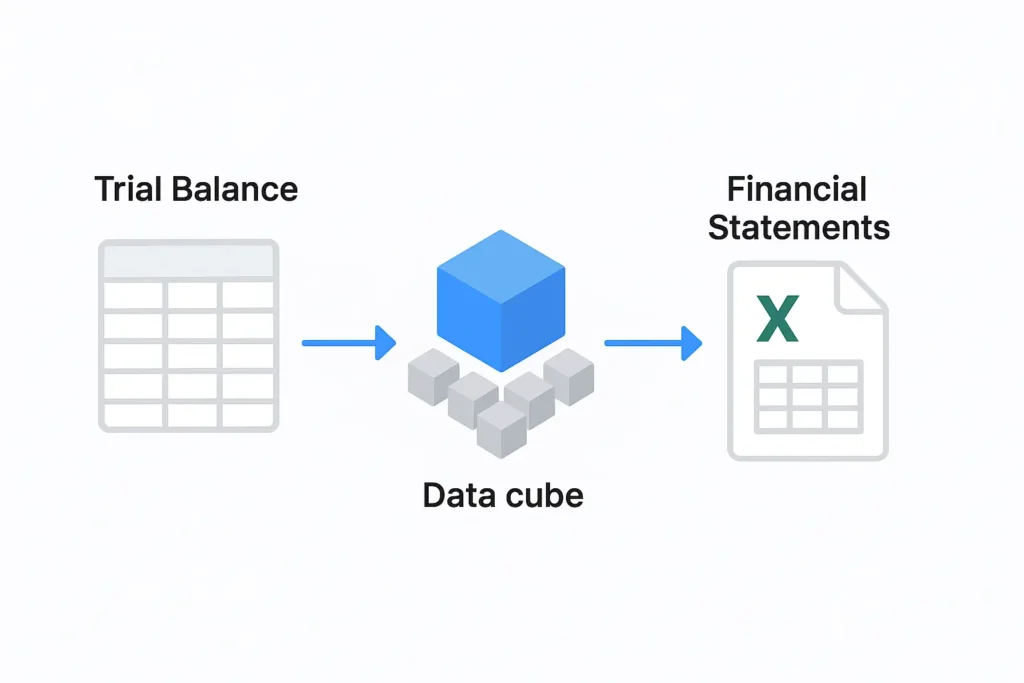
The Automated Approach: Powering Excel with a Multi-Dimensional Database
The most effective way to automate financial statements in Excel isn’t just hooking up a live trial balance feed — it’s storing that data in a multi-dimensional database, also known as a data cube.
Here’s why this matters:
➡ Related Read: Introduction to Data Cubes
1. Set Up Roll-Ups Once and Reuse Them Forever
Instead of writing SUMIFS or VLOOKUP formulas every period, you define account roll-ups directly in the cube (e.g., all revenue accounts → “Revenue” line). Once these roll-ups are set, they apply to any period, entity, or scenario you select.
➡ Related Read: The Role of Roll-Ups and Drill-Downs in MIS Reporting
2. Add Rich Dimensions Beyond the Chart of Accounts
A trial balance only tells part of the story. A multi-dimensional database lets you track and filter by:
- Scenario (Budget, Forecast, Actual, Prior Year)
- Department, Product, or Region
- Time Periods for horizontal analysis (e.g., month-over-month or year-over-year changes)
3. Instantly Switch Between Views
Because the data is structured in dimensions, you can pivot between:
- Consolidated company view
- Individual department or entity view
- Budget vs. Actuals
- Multi-year trend analysis
4. Excel as the Front-End
With a tool like PivotXL, Excel becomes the reporting canvas while the heavy lifting happens in the database:
- Data loads automatically from your accounting system
- Roll-ups and mappings live centrally in the cube
- Reports refresh with a click — no broken formulas, no manual consolidation
➡ Related Read: Why Data Cubes Matter in 2025
💡 Example:
Want to see your income statement for Q2 Actuals vs. Budget, with a year-over-year column for each line item?
In a traditional Excel setup, that’s multiple worksheets, complex formulas, and a lot of risk.
In a cube-powered model, it’s just:
- Select
Scenario = Actual, Budget - Select
Time = Q2 2025, Q2 2024 - Refresh
Final Thoughts
Automating financial statements in Excel doesn’t mean replacing Excel—it means supercharging it.
With the right setup, you’ll:
- Close faster
- Reduce errors
- Spend more time on analysis, not admin work
Related Read: How to Prepare Financial Statements from Trial Balance in Excel
