


📘 This post is part of the ebook: Automating Financial Planning, Reporting & Analysis in Excel
Read the full Table of Contents: Automating Financial Planning, Reporting & Analysis in Excel
⬅️ Previous Chapter: Chapter 7: Automating the Month-End Close
➡️ Next Chapter: Chapter 9: KPIs and Dashboards — Turning Data into Decisions
Introduction
Automated forecasting is transforming how finance teams plan for the future. Once reporting and month-end close are automated, the next evolution is to automate forecasting and scenario planning — helping finance move from historian to strategist.
Traditional spreadsheet-based forecasting is slow and disconnected. Automation creates a living, real-time forecast that updates automatically and aligns with business performance.
Why Automated Forecasting and Scenario Planning Matter
Automated forecasting isn’t about predicting the future perfectly — it’s about preparing intelligently for it.
It helps finance leaders answer:
- Are we meeting our goals?
- What if sales increase 10% or costs rise 5%?
- How will hiring or pricing changes affect cash flow?
Automation delivers these answers instantly, giving leadership real-time insights.
The Traditional Forecasting Process
Before automated forecasting, the process looked like this:
- Finance exports data into Excel.
- Teams manually update numbers.
- Files are consolidated for review.
- Scenarios are copied and edited across multiple sheets.
This leads to slow updates, version chaos, and limited “what-if” analysis. Automation fixes this with connected data and structured forecasting models.
The Automated Forecasting Framework
Automated forecasting uses the same data cube or central database that powers financial reporting — but applies it forward in time.
1. Central Data Model
All actuals, budgets, and departmental data reside in one place — your SQL, MongoDB, or PivotXL database.
Forecasting adds a simple new layer: Scenario = Forecast, stored right alongside actual and budget data.
2. Linked Excel Templates
Dynamic Excel templates pull in:
- Actuals up to the current month
- Budgets for future months
- Live drivers like growth rates, pricing, or headcount
When assumptions change, formulas recalculate instantly and push updated values back into the data cube.
3. Scenario DriversYou can now simulate multiple business outcomes by tweaking assumptions such as:
- Revenue growth percentage
- Cost inflation rate
- Headcount or capacity changes
- FX rates or pricing models
Each scenario (Base / Best / Worst) refreshes automatically — updating P&L, balance sheet, and cash flow in real-time.
4. Continuous Rolling Forecast
Instead of quarterly updates, rolling forecasts update every month.
Actual results replace forecasted months, while projections extend forward — keeping a full 12–18 month outlook live at all times.
This enables an always-current, always-relevant view of business performance.
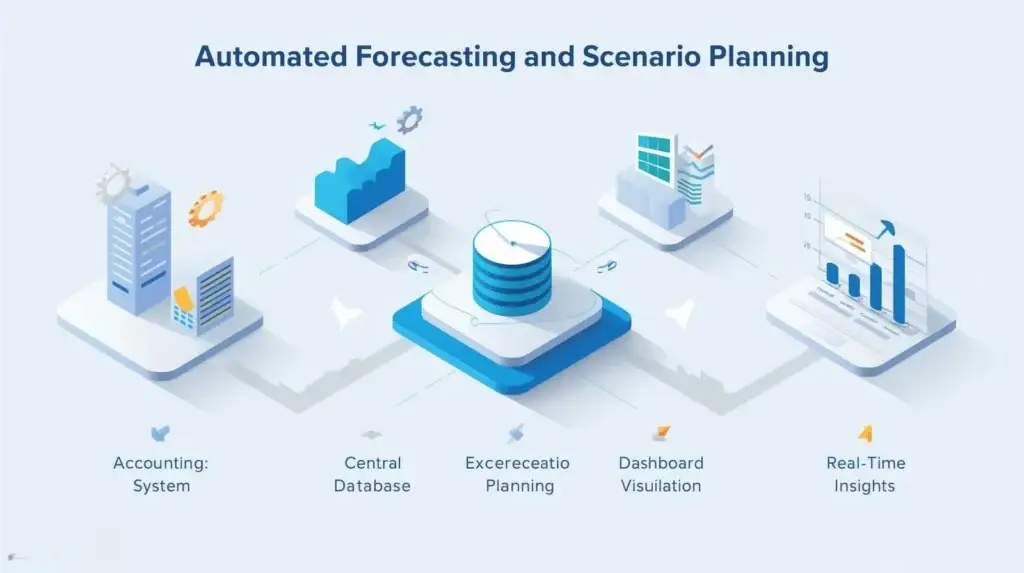
Diagram: Automated Forecasting Process Flow

Automated Scenario Planning in Practice
Automated forecasting enables quick “what-if” simulations like:
- What if sales drop 10% in Q4?
- What if costs rise 15%?
- What if hiring is delayed?
Because data and assumptions are linked, updates flow instantly into dashboards and reports.
Why Automation Improves Forecasting
| Challenge | Automated Solution |
|---|---|
| Manual Excel models | Centralized forecast system |
| Slow consolidation | Automatic rollup across entities |
| Hard-to-track assumptions | Structured driver tables |
| Outdated data | One-click refresh |
| Inconsistent formulas | Locked, standardized templates |
Automation makes forecasting faster, smarter, and more reliable.
Integrating Automated Forecasting with Reporting
Forecasting and reporting share the same foundation — the chart of accounts, data cube, and Excel interface.
This integration ensures forecasts feed directly into variance reports, cash flow projections, and management dashboards.
Conclusion
Automating forecasting and scenario planning transforms finance from reactive to proactive.
By integrating forecasts with live data, automating assumptions, and maintaining rolling views, finance teams can plan continuously — not just once a year.
The result?
✅ Faster decisions,
✅ Clearer insights, and
✅ Greater confidence in every financial plan.
PivotXL empowers finance teams to achieve this transformation seamlessly.
With its automated forecasting engine, connected data cubes, and dynamic Excel integration, PivotXL helps you move beyond spreadsheets — enabling continuous, data-driven scenario planning and smarter business forecasting.
Start automating your financial forecasting today with PivotXL

