


📘 This post is part of the ebook: Automating Financial Planning, Reporting & Analysis in Excel
Read the full Table of Contents: Automating Financial Planning, Reporting & Analysis in Excel
⬅️ Previous Chapter: Chapter 5: Automating Financial Reporting in Excel
➡️ Next Chapter: Chapter 7: Automating the Month-End Close

Introduction: Why Automating Financial Analysis in Excel Matters
Financial reporting tells you what happened — but financial analysis reveals why it happened and what to do next.
Once your reports are automated, the next step is automating financial analysis in Excel to transform static spreadsheets into live business intelligence.
Traditional Excel workflows demand hours of manual effort — copying data, fixing formulas, and re-creating charts every month. Automation changes that. It delivers instant ratio updates, dynamic variance analysis, and KPI dashboards that refresh automatically with your latest data.
With automation, finance teams stop crunching numbers — and start providing insights that drive strategic decisions.
Automating Financial Analysis in Excel: The Traditional Process
Manual analysis in Excel often involves:
- Copying P&L and Balance Sheet data into a new file
- Building formulas for ratios (e.g., Gross Margin, Current Ratio, Debt-Equity)
- Adding charts for monthly comparisons
- Repeating everything each month
This method is inefficient and error-prone. Each data update triggers rework, and insights arrive too late to be useful.
Automation fixes this by creating dynamic, reusable models that update automatically — ensuring accuracy and saving time.
How to Automate Financial Analysis in Excel
Automation doesn’t replace Excel — it enhances it. Here’s how modern finance teams automate analysis:
1. Centralized Data Feeds for Financial Analysis
Your financial data (Actuals, Budgets, Forecasts) should live in a central database or cube connected to Excel.
Each entry includes dimensions like:
- Time period
- Department or entity
- Account group (Revenue, Expense, Asset, Liability)
With this setup, every ratio, trend, and report updates instantly when new data is imported — no manual edits required.
2. Predefined Analytical Formulas in Excel
Instead of rebuilding formulas each month, define your key ratios once in standardized Excel templates.
| Category | Example Formula | Meaning |
|---|---|---|
| Profitability | =Gross Profit / Net Revenue | Gross Margin % |
| Liquidity | =Current Assets / Current Liabilities | Current Ratio |
| Efficiency | =COGS / Average Inventory | Inventory Turnover |
| Leverage | =Total Debt / Shareholder Funds | Debt-Equity Ratio |
| Return | =EBITDA / Capital Employed | Return on Capital Employed (RoCE) |
Once connected to live data, these formulas update automatically after every data refresh.
3. Automated Variance Analysis
Variance analysis — comparing Budget vs Actual or Forecast vs Actual — becomes seamless.
Automated templates handle this through structured logic:
Variance = Actual - Budget
Variance % = (Actual - Budget) / Budget * 100
You can view variances by department, account group, or time period — and they all update the moment new data arrives.
4. Trend and KPI Dashboards
Automation brings your numbers to life through dynamic dashboards.
Add:
- Sparklines for quick monthly trends
- Conditional formatting for deviations
- PivotTables and Slicers for filters
- Dynamic charts for revenue, margin, or expense patterns
Every visual refreshes automatically — turning Excel into an interactive dashboard for financial insights.
Why Automating Financial Analysis in Excel Is Essential
Automating financial analysis in Excel delivers far more than just speed — it transforms the finance function into a strategic enabler.
It shifts your role:
- From data preparation → decision enablement
- From reporting history → predicting outcomes
Automation ensures:
✅ Consistent ratio definitions
✅ Comparable, reliable trend analysis
✅ Always up-to-date business metrics
Example: Manual vs Automated Financial Analysis Flow
| Step | Manual Process | Automated Process |
|---|---|---|
| Data Collection | Export and paste into Excel | Auto-refresh from central cube |
| Ratio Calculation | Rebuild formulas each month | Predefined formulas auto-update |
| Variance Analysis | Recreate tables manually | Prebuilt variance model refreshes |
| Dashboard | Redo charts and highlights | Charts auto-refresh automatically |
| Insight | Delivered days later | Delivered instantly |
Automation compresses the close-to-analysis cycle from days to hours, giving finance teams time for true analysis — not repetitive work.
The Strategic Impact of Financial Analysis Automation
When financial analysis in Excel is automated, every department gains real-time visibility into how decisions affect profitability and growth.
Finance evolves from being a “reporting center” to a strategic business partner — delivering faster forecasts, accurate insights, and smarter decisions.
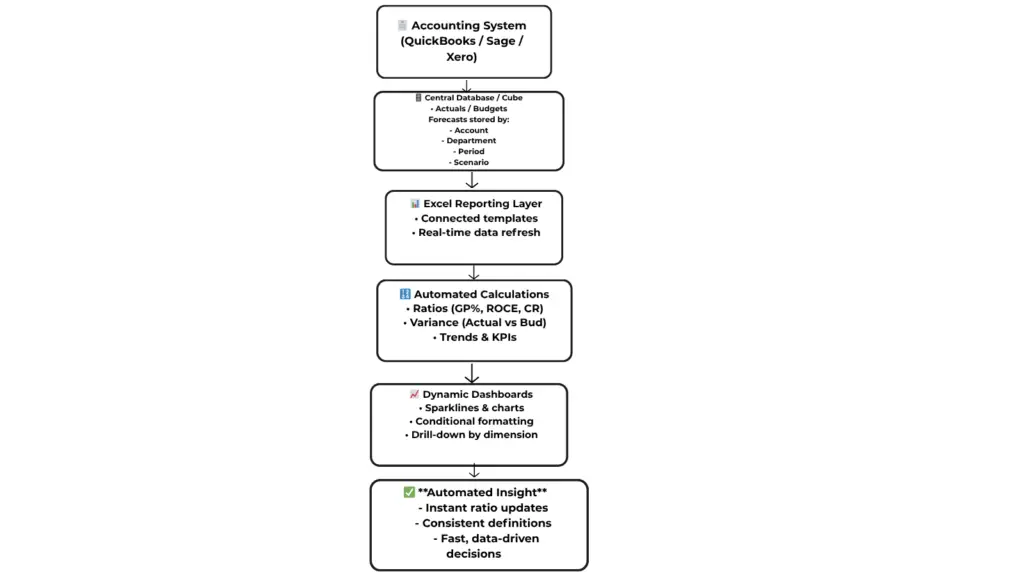
Diagram: Automated Financial Analysis Flow
From Data to Insight: How Automated Financial Analysis Works
Conclusion: Bridging the Gap Between Data and Decision
Automating Financial Analysis in Excel allows businesses to move beyond static reports and into actionable insight.
By connecting Excel to live data, embedding ratio logic, and automating dashboards, finance teams eliminate repetitive tasks and ensure every decision is based on up-to-date information.
With platforms like PivotXL, this becomes seamless — combining Excel’s flexibility with centralized data reliability.
Result:
⚡ Faster analysis, 💡 smarter insights, and a finance team that drives business growth through automation.

