Introduction
Multidimensional data cubes (cubes) are commonly used in financial and operational analytics. Many Vendors and CFO’s are touting its benefits. Yet, we have not found good articles that explain the basic concepts of cubes. In this blog post, we will cover the basics of cubes through the use case of a grocery chain.
A brief history of Data Cube
The fancy name for a multi-dimensional cube is an OLAP database. OLAP – Online Analytical Processing, as the name suggests is useful for analytics. OLAP databases were different than relational databases such as SQL. SQL was good for storing and retrieving small amounts of transactional data faster. OLAP was better at slicing and dicing large amounts of data to create reports.
Today, many databases have optimized their SQL queries. As a result, the speed of data extraction is not as much of an issue. For example, Amazon Redshift, Google Big Query and Snowflake databases are designed for querying. Even standard database providers such as MySQL have improved their query performance.
So what are the benefits of cubes? One of the key advantages of cube architecture is the simplicity in slicing and dicing the data. Tools such as Pivot Tables built for cubes have made this easy.
Example Case Study
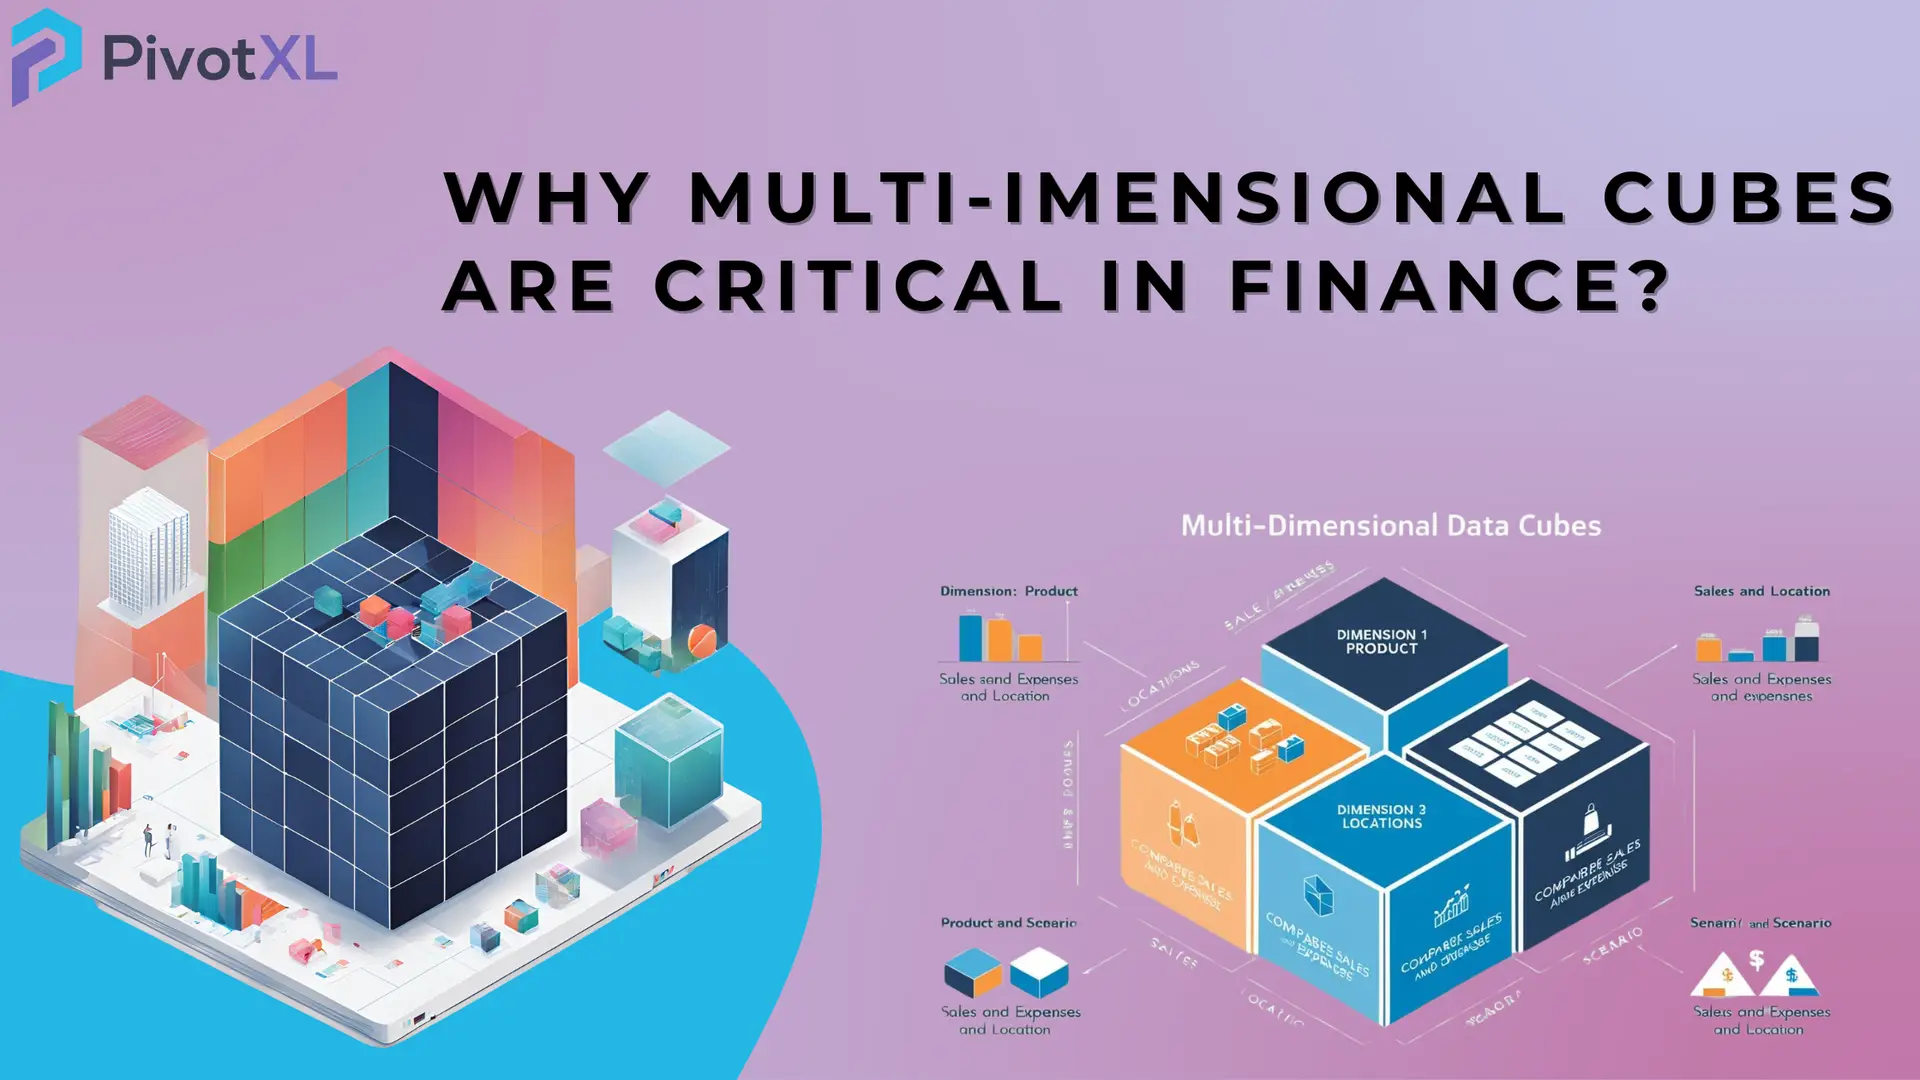
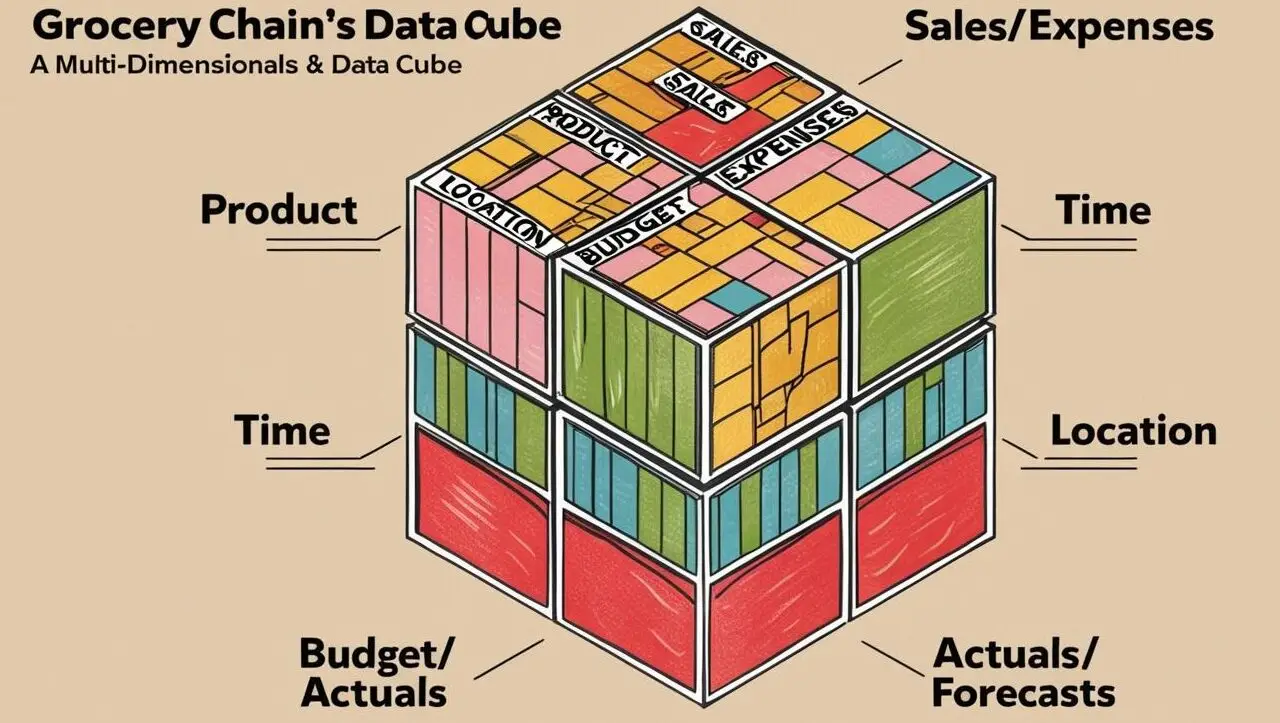
Let’s consider a grocery chain with multiple stores, where data is collected for sales, expenses, and other metrics.
Dimensions:
- The grocery chain tracks sales by Products (Dimension 1) and Time (Dimension 2).
- It also collects data for every Location (Dimension 3).
Adding Scenarios:
- To support planning, data can include Budget, Actuals, and Forecasts as another dimension (Dimension 4).
- This additional layer enables the team to compare actual performance against budgets or forecasts.
Including Expenses:
- Alongside sales, the grocery chain also tracks Expenses.
- Both metrics—Sales and Expenses—share dimensions like Products, Time, and Location, making it easy to compare them.
Benefits of Data Cubes
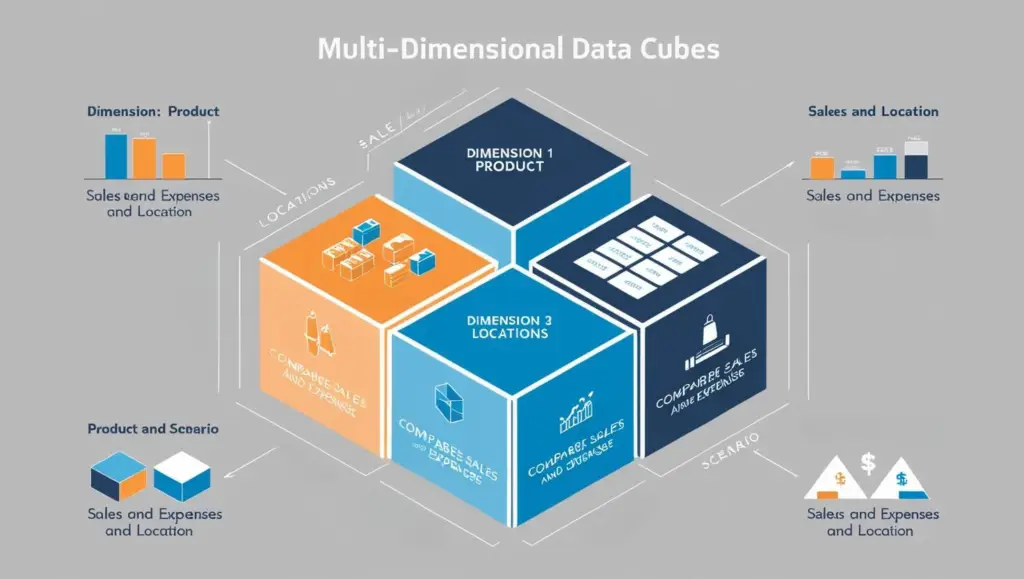
Once you have the data stored in a cube, you can slice and dice the data in many ways. For example, scenario (Dimension 4) can be compared with Product (Dimension 1). As illustrated below.
Scenario (Dimension 4) can be compared with Locations (Dimension 3)
Both sales and expenses can be compared across Product (Dimension 1) and Locations (Dimension 3).
Pivot Table
If you’ve worked with Pivot Tables in Excel, you’re already familiar with the concept of multidimensional data cubes. Pivot Tables allow you to drag and drop dimensions (like Time, Products, and Location) to summarize and analyze data quickly.
While Pivot Tables are effective for small datasets, multidimensional cubes handle much larger datasets with greater efficiency and scalability.
Multi-Dimensonal cubes as cloud Application
Cloud-based data Multi-Dimensonal cubes enhance the capabilities of traditional spreadsheets, offering features like:
- Automation: Automatically update sales, expenses, and performance metrics without manual input.
- Real-Time Collaboration: Enable teams to access and update the same data simultaneously.
- Custom Alerts: Get notifications for anomalies, such as sales falling below a threshold.
- Detailed Analytics: Spend more time analyzing data and less time organizing it.
For instance, a grocery chain can set up a cube to track daily store footfall and weekly sales performance. Automated reports save time, allowing managers to focus on strategic tasks like identifying customer preferences or planning promotions.
PivotXL is a cloud based cube application that can allow finance admins to create cubes in a web application and link Excel spreadsheets to it.