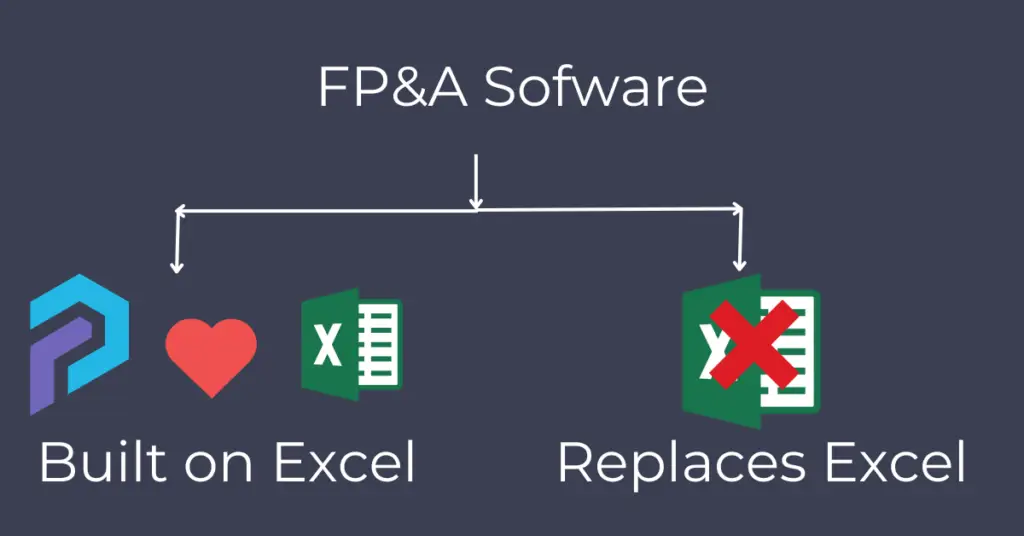
If you’re exploring Excel-based FP&A software, you likely already know how these tools enhance financial planning by automating processes and improving collaboration. Two key players in this space are DataRails and PivotXL. While both tools aim to simplify FP&A with similar features, there are some key differences in pricing and market position. So depending on the type of company, each solution might be a better fit.
A Brief Introduction to DataRails
DataRails began as a platform specifically designed to enhance Excel-based workflows, initially focusing on streamlining data consolidation and reporting. However, over time, the company recognized the growing need for more sophisticated FP&A tools. Consequently, it pivoted into this space to support financial planning, budgeting, and forecasting. As a result, today, DataRails caters to mid-market and enterprise firms by leveraging its strong roots in Excel while simultaneously providing advanced features that extend far beyond the limitations of basic spreadsheets.
More Free Excel templates?
Get access to our entire library of templates designed for accounting and finance.
A Brief Introduction to PivotXL
PivotXL was created to address the complexities finance teams often face, all while still leveraging the power and familiarity of Excel. From the outset, its mission has been to make financial planning more accessible and collaborative by providing a platform that integrates seamlessly with Excel. Moreover, PivotXL’s emphasis on affordability and ease of use has contributed to its growing popularity among small to medium-sized businesses. As a result, it enables teams to build dynamic models and share insights efficiently, all without the need for extensive IT support.
Similarities Between DataRails and PivotXL
Both DataRails and PivotXL are Excel-based FP&A tools that capitalize on the familiarity of Excel while introducing advanced features to enhance financial planning. By leveraging these tools, finance teams can automate workflows, improve collaboration, and create dynamic models—all without needing to leave the Excel environment. Furthermore, with features such as data consolidation, budgeting, and forecasting, both solutions effectively cater to organizations seeking to streamline and optimize their financial processes.

Datarails vs PivotXL – Key Differences
1. Ease of Use
- DataRails: While offering a wide array of features, it can sometimes feel overwhelming for users who prefer a more straightforward and intuitive experience.
- PivotXL: By contrast, PivotXL maintains a focus on simplicity, keeping everything Excel-based and user-friendly. Additionally, it provides an optional web dashboard for those who prefer not to use Excel or need an easy way to share charts and graphs with other business users.
2. Pricing
- DataRails: Pricing for DataRails starts at $2,000 per month, positioning it as a solution primarily suited for mid-market firms with larger budgets.
- PivotXL: In contrast, PivotXL offers pricing starting at just $100 per month, making it an accessible and cost-effective option for small to medium-sized enterprises.
3. Advanced Features
PivotXL provides advanced capabilities for uploading transaction data and importing custom outputs directly from source systems. These features ensure seamless data integration, enabling finance teams to efficiently manage and analyze their financial data while maintaining accuracy and consistency.
- Custom Tables and Filters: Custom Tables and Filters: Simplify transactional data slicing and dicing for better analysis.
- Custom Scripts: Automate complex tasks for greater efficiency using Ruby scripts.
- PowerPoint Integration: Seamlessly create presentations directly from your data.
- Task Management: Advanced task management functionality streamlines budgeting and month-end close processes.
DataRails vs PivotXL – A Detailed Comparison
Here is a detailed feature wise comparison between PivotXL and DataRails.
| PivotXL | Datarails | Benefits | |
| Storing Data in Cubes | Yes | Yes | Multi-dimensional cubes store data in a highly efficient manner, enabling seamless organization and retrieval. These cubes simplify the process of comparing budgets with actuals while allowing finance teams to analyze data from multiple angles, such as time, departments, or product categories, providing deeper insights for decision-making. |
| Excel Add-In (GET/SEND Data) | Yes | Yes | Excel (Send/Get Data) functionality allows you to seamlessly pull data from cubes into Excel and send updates back to the cubes. This feature enables you to use the data for reporting, analysis, and calculations within the familiar Excel environment, streamlining workflows and enhancing efficiency. |
| Excel Reporting | Yes | Yes | Managers often prefer clean, well-formatted Excel reports for clear and professional communication. Excel add-ins make this process effortless by allowing you to pull data directly from source systems or cubes, apply custom formatting, and share reports seamlessly. This ensures consistency, accuracy, and efficiency in report generation and distribution. |
| Excel as calculation engine | Yes | Yes | Excel excels at handling calculations thanks to its intuitive formula and function capabilities. Furthermore, you can easily pull data from a database, apply formulas for in-depth analysis or computation, and subsequently send the results back to the database. This ensures a seamless, efficient workflow for both data processing and reporting, enhancing productivity and accuracy in financial and operational tasks. |
| Audit Trails | Yes | No | Databases efficiently track changes whenever data is sent, thereby providing a clear and comprehensive audit trail. This functionality not only allows you to see who made changes but also when they were made and what specific updates were performed. Consequently, it ensures transparency, promotes accountability, and safeguards data integrity throughout the process. |
| Sharable Web Dashboards | Yes | Yes | Build interactive web dashboards directly within the application, thereby enabling users to visualize and analyze data seamlessly. Moreover, these dashboards support real-time collaboration, which allows teams to work together effortlessly without relying on external tools. As a result, workflows are streamlined, and productivity is significantly enhanced. |
| Consolidated Data – Upload | Yes | Yes | Import datasets, such as trial balances, with ease using intuitive tools that handle various file formats seamlessly. These tools simplify data uploads, ensuring flexibility and efficiency while accommodating the diverse data management needs of finance teams. |
| Transaction Data – Upload | Yes | No | Break transaction data into smaller chunks by date or keywords. Upload and reorganize the raw data for better analysis. |
| Custom Script – Upload | Yes | No | Use scripts to handle complex data exports. Scripts prepare and upload data into the database seamlessly. |
| API Based Import | Yes | Yes | APIs automate data access. Some systems lack custom APIs, but available ones simplify workflows and save time. |
| Web Calculation Engine | Yes | No | Create calculations for management reports within the system or use Excel templates. Choose the method that fits your workflow. |
| Template Storage | Yes | Yes | Store Excel templates in the application for easy access. This keeps templates organized and searchable. |
| User Management | Yes | Yes | Admins set tasks and manage calculations. Basic users access limited functions, keeping the system organized and secure. |
| Roll-Ups Definition | Yes | Yes | Define how to consolidate and roll up data using simple interfaces. Combine sources without writing complex formulas. |
| Drill Down Data | Yes | Yes | Start with a high-level view of data. Drill down into categories or transactions to see detailed information. |
| Task Management | Yes | No | Organize workflows with task management. Track progress, assign accountability, and collaborate in real-time. |
| Draft Task – Budgeting Process Management | Yes | No | Automate budgeting with notes and calendars. Streamline the process and save time on repetitive tasks. |
| Recurring Task – automate month end close checklist | Yes | No | Automate monthly close tasks. Track progress, ensure accountability, and simplify reviews with recurring checklists. |
| Powerpoint Integration | Yes | No | Create PowerPoint templates. Generate presentations quickly with pre-filled data, saving time and effort. |
| Advanced Excel to Cube mapping features | Yes | No | Map Excel data to cubes through cell or bulk mapping. Add rows and columns to handle complex data needs. |
| Advanced Automated-Excel Editing Features | Yes | No | Hide empty rows in Excel automatically. Keep tables dynamic and focus on relevant data without manual cleanup. |
| Free Proof Of Concept | Yes | No | We understand your needs and show tailored solutions. Our proof of concept highlights the system’s value to your business. |
| Pricing – Starts $100+/Month | Yes | No | Our pricing starts at $100/month. We offer cost-efficient, high-value solutions compared to others starting at $2,000/month. |
Final Thoughts
If your organization is large and requires extensive data integrations and sophisticated dashboards, DataRails could be the ideal choice. However, for most teams seeking a simple, cost-effective solution that enhances Excel’s capabilities, PivotXL stands out as the clear winner. With its ease of use, affordable pricing, and Excel-focused approach, PivotXL emerges as the best FP&A solution for 2025.


