


In my 25-plus years in finance, I have come to realize that financial statements are much more than a set of numbers on a page. They are the language of business—a powerful tool that reveals the health, stability, and potential of a company. One of the most common queries I receive is about the Difference Between Balance Sheet and Income Statement. Whether you are a business owner, an investor, or someone beginning a career in finance, understanding these statements will empower you to make informed decisions.
In this guide, I will walk you through the two most critical financial documents: the balance sheet and the income statement. I will explain what they are, how they work, and why they matter. Moreover, I will demonstrate how they interconnect and how you can use them to shape strategic decisions. As you read on, you will discover that these tools, when properly understood, serve as your roadmap to the financial well-being and success of any business.
The Three-Statement Financial Model: A Comprehensive Overview
Before we delve into the details, it is important to see how financial statements work together. Companies typically use three main statements to communicate their financial performance:
- Balance Sheet: This document shows the company’s assets, liabilities, and equity at a specific moment in time. It acts like a snapshot of the business’s overall financial position.
- Income Statement: Often referred to as the profit and loss (P&L) statement, it summarizes the revenues, expenses, and profits over a set period. It is like a movie that shows how the company performed over time.
- Cash Flow Statement: This statement tracks the actual flow of cash in and out of the company. It breaks down cash flows into operating, investing, and financing activities.
Moreover, these three statements together provide a complete picture of a company’s financial health. They do so by addressing key questions about what the company owns, how it earns money, and how it manages its cash. In addition, by using these statements in tandem, stakeholders are better able to make strategic decisions that lead to long-term success.
The Balance Sheet: A Snapshot of Financial Position
What Is a Balance Sheet?
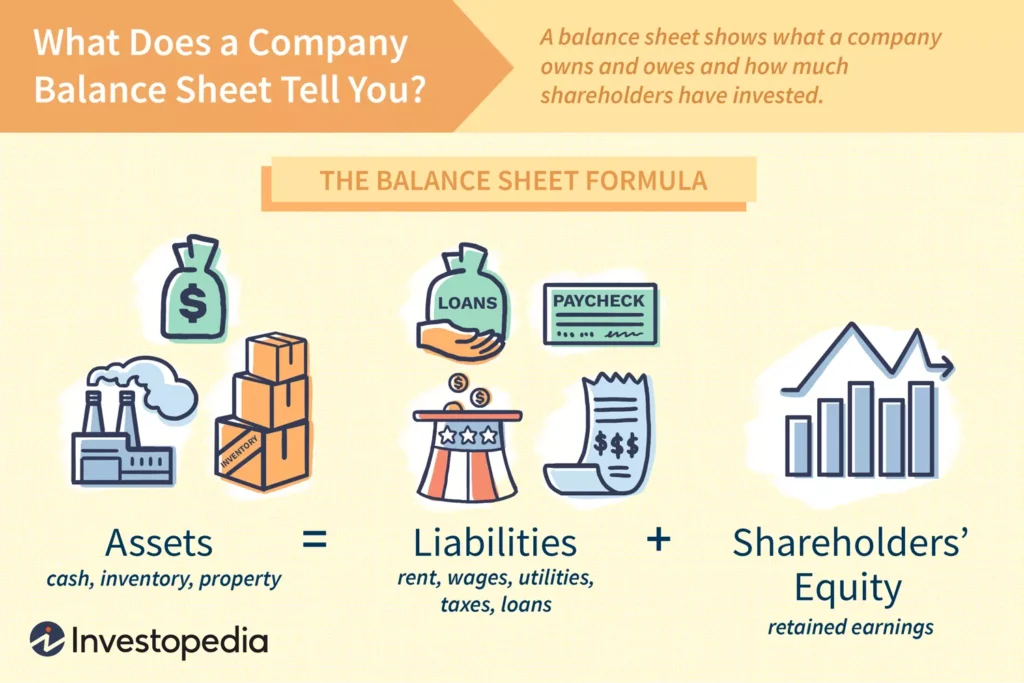
In my long experience, I have seen that a balance sheet is one of the most powerful tools in finance. It captures a company’s financial position at one specific moment, thereby answering three fundamental questions:
- What does the company own?
- What does the company owe?
- How much have the shareholders invested?
To put it simply, the balance sheet adheres to the fundamental equation:
Assets = Liabilities + Equity
This equation always holds true and forms the backbone of the balance sheet.
Breaking Down the Balance Sheet
To better understand the balance sheet, it is useful to break it down into its main components. In this section, I will explain each component in detail.
Assets: The Company’s Valuable Resources
Assets represent all the resources that a company owns and that have future economic benefits. There are two primary categories of assets:
Current Assets
Current assets are resources that can be converted into cash within one year. They include:
- Cash and Cash Equivalents: These are the funds that are readily available, such as money in the bank and other short-term investments.
- Accounts Receivable: These are funds owed to the company by customers who have purchased goods or services on credit.
- Inventory: This includes goods that are ready for sale, as well as raw materials and work-in-progress.
For instance, if you run a retail business, cash and inventory are critical because they provide the liquidity needed to operate day-to-day.
Non-Current Assets
Non-current assets, also known as long-term assets, provide benefits over a longer period. They include:
- Property, Plant, and Equipment (PP&E): These are physical assets such as buildings, machinery, and equipment.
- Intangible Assets: These assets are not physical but hold value, such as patents, trademarks, and goodwill.
- Long-Term Investments: These are investments that the company intends to hold for more than one year.
Thus, while current assets support immediate operations, non-current assets are crucial for long-term growth and sustainability.
Liabilities: The Company’s Debts and Obligations
Liabilities show what the company owes to external parties. They, too, are divided into two groups:
Current Liabilities
Current liabilities are obligations that the company must settle within one year. They include:
- Accounts Payable: These are amounts the company owes to suppliers for goods and services.
- Short-Term Debt: These are loans and other debts that are due within the year.
By examining current liabilities, you can quickly assess whether a company has the short-term liquidity to meet its obligations.
Non-Current Liabilities
Non-current liabilities are debts or obligations that extend beyond one year. They include:
- Long-Term Debt: This category encompasses loans, bonds, and mortgages that require repayment over an extended period.
- Deferred Tax Liabilities: These are taxes that the company has accrued but will pay in the future.
For example, if a company has a significant amount of long-term debt, it may signal a reliance on borrowing, which in turn affects its long-term financial stability.
Equity: The Residual Interest
Equity represents the owners’ claim on the company after all liabilities have been subtracted from assets. It is sometimes referred to as shareholders’ equity or net worth. Equity typically comprises:
- Common Stock: The funds that shareholders have invested in the company.
- Retained Earnings: The accumulated profits that have been reinvested back into the company rather than distributed as dividends.
- Additional Paid-In Capital: This is the extra money that investors have paid over the nominal value of the shares.
Consequently, equity shows how much the company’s owners have contributed and how much profit has been retained for future growth.
How Business Leaders Use the Balance Sheet
Over the years, I have observed that the balance sheet is indispensable for business leaders. They use it for several strategic purposes:
- Liquidity Analysis: By comparing current assets and current liabilities, leaders can determine if the company can cover its short-term debts.
- Financial Stability: A strong balance sheet with robust equity and manageable liabilities indicates that the company is on solid financial footing.
- Investment Evaluation: The balance sheet helps identify areas where resources might be underutilized or where investment is needed.
- Securing Financing: Lenders scrutinize the balance sheet to evaluate creditworthiness and the company’s ability to repay debt.
Thus, the balance sheet not only shows what the company owns but also how well it is positioned for the future.
The Income Statement: Tracking Performance Over Time
What Is an Income Statement?
While the balance sheet provides a static snapshot, the income statement captures the dynamic performance of a company over a given period. It tells you how well the company has performed by summarizing its revenues, expenses, and ultimately, its profits or losses. The formula at the heart of the income statement is:
Net Income = Revenue – Expenses
This statement is vital because it shows whether the company is making money or losing it over time.
Breaking Down the Income Statement
Next, I will explain the main components of the income statement. To ensure clarity, I will divide this discussion into key parts.
Revenue: The Starting Point
Revenue represents the total money earned by the company through its primary operations. It is the top line of the income statement and serves as the starting point for calculating profit. Revenue includes:
- Sales Revenue: The income from selling goods or services.
- Other Income: Earnings from sources outside the core business, such as interest, royalties, or gains on the sale of assets.
Because revenue is so fundamental, it is the first indicator of the company’s ability to generate business.
Expenses: The Costs of Doing Business
Expenses are the costs incurred to generate revenue. They are detailed in several categories:
- Cost of Goods Sold (COGS): These are the direct costs of producing the goods or services that the company sells.
- Operating Expenses: This broad category includes salaries, rent, utilities, and depreciation. In addition, it covers expenses related to day-to-day operations.
- Other Expenses: These may include interest payments and taxes.
For example, if a company spends too much on operating expenses, its profitability may be squeezed, even if revenue is high.
Net Income: The Bottom Line
After all expenses have been deducted from revenue, the result is the net income. This figure is often referred to as the “bottom line” because it sits at the bottom of the income statement. It is an essential measure of performance:
- Positive Net Income: Indicates that the company is profitable.
- Negative Net Income: Signifies that the company is operating at a loss.
In addition, net income serves as a crucial metric for assessing overall business performance and is often used to evaluate management efficiency.
How the Income Statement Guides Decision-Making
In my career, I have observed that the income statement plays a central role in shaping business strategy. Business leaders use it to:
- Evaluate Profitability: By monitoring revenue and expenses, leaders can determine whether the company is earning sufficient profit.
- Manage Costs: The income statement helps identify areas where expenses may be reduced without compromising quality.
- Plan for Growth: Trends in revenue and net income provide insights into the company’s growth potential.
- Build Investor Confidence: A consistently positive net income increases the likelihood that investors will continue to support the business.
Consequently, the income statement is a vital tool for monitoring operational performance over time.
Comparing the Balance Sheet and Income Statement
Although both the balance sheet and the income statement are essential, they serve distinct purposes. Therefore, it is important to understand the differences between them.
Purpose and Time Frame
- Balance Sheet:
- Purpose: It provides a snapshot of the company’s financial position at a specific point in time.
- Time Frame: It is like a photograph that captures the company’s assets, liabilities, and equity as of one particular day.
- Income Statement:
- Purpose: It shows the company’s performance over a given period by detailing revenue, expenses, and net income.
- Time Frame: It functions more like a movie, illustrating how the business performed over weeks, months, or years.
Insights Provided
- Balance Sheet:
- It reveals liquidity by showing whether the company can cover its short-term obligations.
- It indicates financial stability by examining long-term assets versus long-term liabilities.
- Income Statement:
- It highlights profitability by showing whether the company is making or losing money.
- It provides insight into operational efficiency by comparing revenues with expenses.
Thus, while the balance sheet provides a static view of financial health, the income statement delivers a dynamic picture of performance.
How the Statements Interconnect
Even though the balance sheet and income statement have distinct roles, they are interconnected. Over the years, I have observed several ways in which these documents work together.
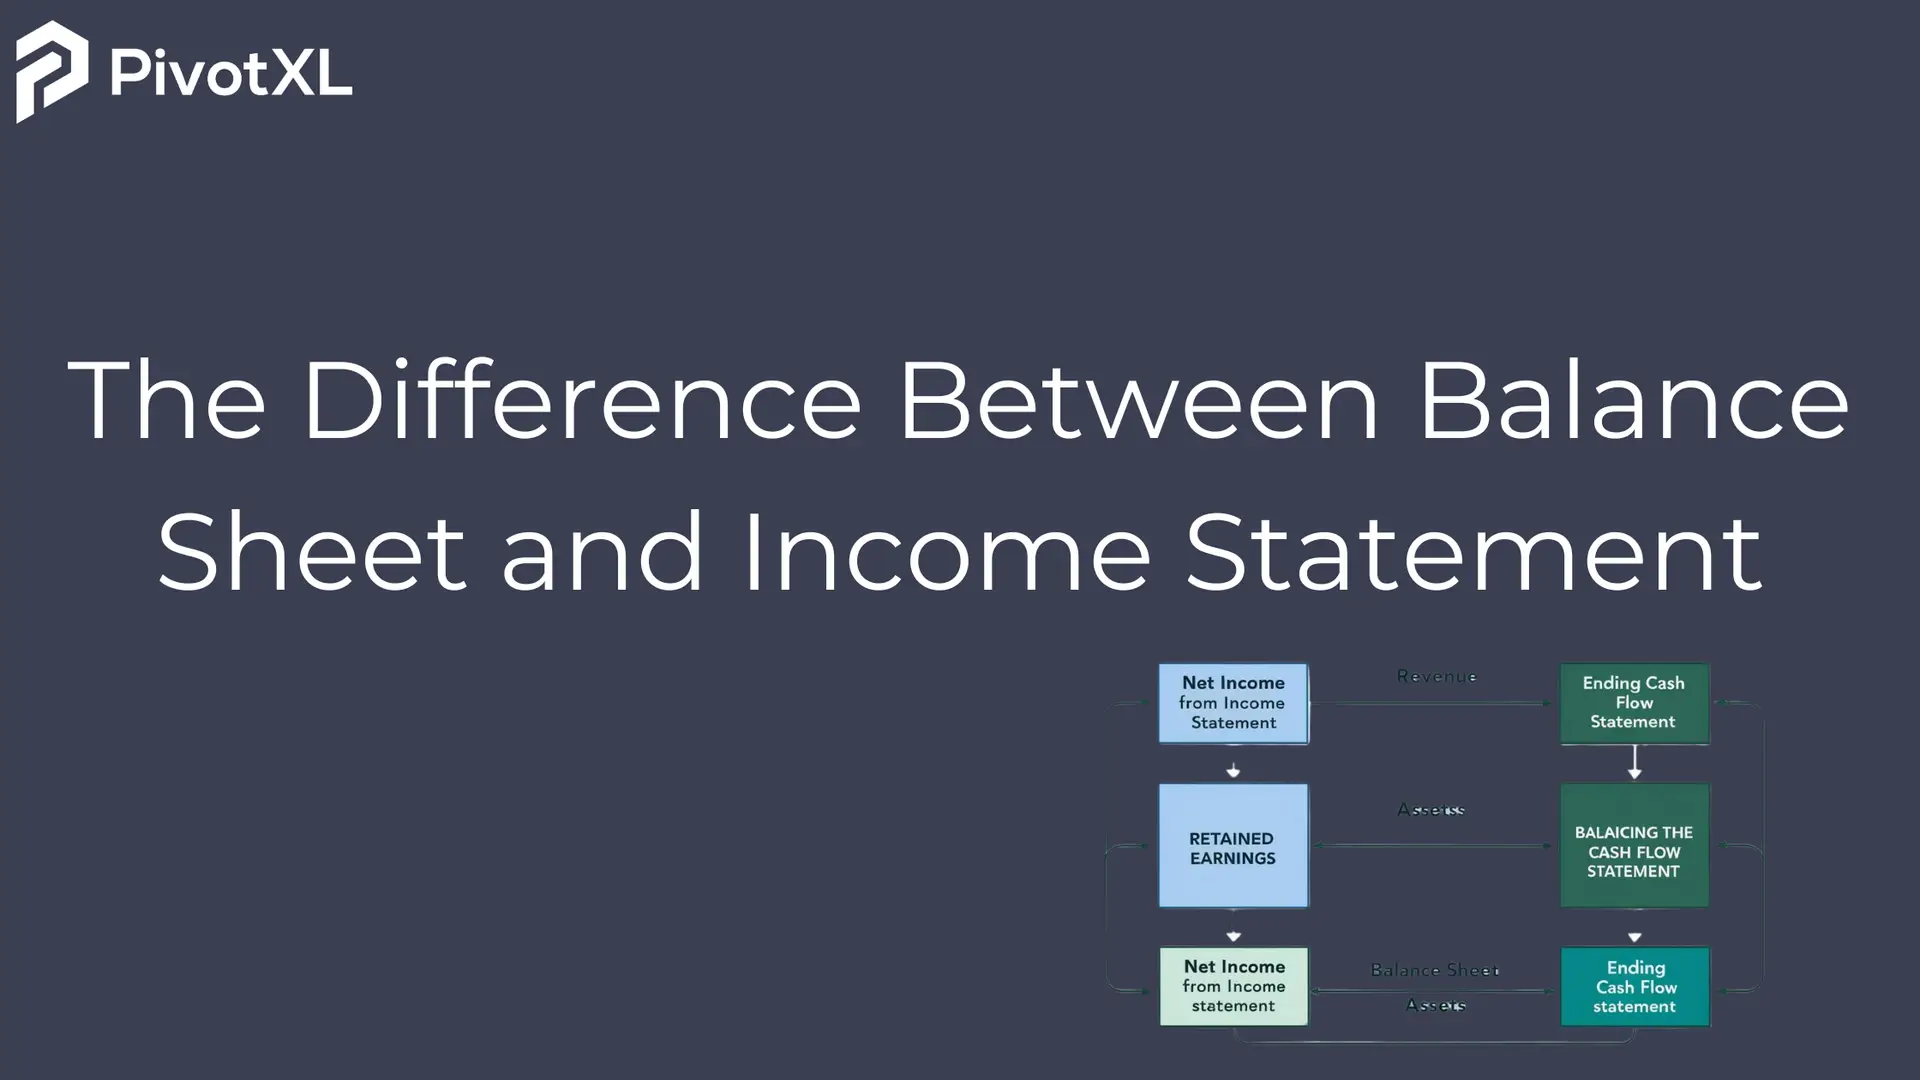
The Bridge of Retained Earnings
At the end of each accounting period, the net income (or loss) from the income statement is transferred to the balance sheet as retained earnings. This transfer creates a continuous link between the two documents. For instance, if a company has generated profit over several periods, the cumulative retained earnings will increase, thereby strengthening the balance sheet’s equity section. Conversely, a loss will reduce retained earnings, which might signal financial challenges.
The Role of the Cash Flow Statement
In addition, the cash flow statement further connects the balance sheet and income statement. It translates the net income into actual cash that flows in and out of the business. This statement:
- Details how cash generated from operations is used to fund investments or pay off debt.
- Ensures that the cash balance reported on the balance sheet accurately reflects operational performance.
Thus, through retained earnings and the cash flow statement, you can see a clear and continuous flow of information between the income statement and the balance sheet.
Strategic Decision-Making with Financial Statements
After decades in the field of finance, I can confidently say that understanding these financial statements is essential for making sound strategic decisions. In this section, I will discuss how you can apply these insights in real-life scenarios.
Investment Decisions
Before committing to any major investment, companies must assess whether they have the necessary financial resources. Here is how you can use the financial statements:
- Examine the Balance Sheet: Check if the company has strong assets and manageable liabilities. A robust balance sheet indicates that the company is well positioned to invest in growth.
- Analyze the Income Statement: Look for consistent profit growth. Steady revenue increases and controlled expenses suggest that new investments could yield positive returns.
For example, if a retail business wants to open several new stores, it should first ensure that its balance sheet shows a strong asset base and minimal long-term debt. Simultaneously, it should confirm that the income statement reflects a trend of increasing profitability. Only then will the investment decision be well-founded.
Financing Decisions: Debt Versus Equity
Another important decision is choosing between debt and equity financing. Financial statements help in this regard:
- Balance Sheet Insight: If a company has high levels of debt, taking on more debt might not be advisable. Instead, raising equity may help strengthen the capital structure.
- Income Statement Analysis: A strong history of net income makes it easier to secure loans at favorable interest rates. Conversely, if profits are volatile, equity financing might be safer.
Thus, by analyzing both the balance sheet and the income statement, companies can choose the financing option that best supports long-term stability.
Cost Management and Pricing Strategies
Cost management is critical to maintaining profitability. The income statement provides detailed information on operating expenses. You can use this data to:
- Identify High-Cost Areas: Determine which expense categories are unusually high compared to industry benchmarks.
- Negotiate Better Terms: With clear cost insights, you can negotiate with suppliers or seek alternative vendors.
- Set Competitive Prices: Knowing your cost structure enables you to set prices that cover costs and yield a healthy margin.
For example, if a manufacturing company discovers that its cost of raw materials is significantly higher than competitors, it might explore alternative suppliers or bulk purchase agreements. Simultaneously, understanding the cost structure helps the company set competitive prices that ensure profitability.
Operational Efficiency and Long-Term Growth
Operational efficiency is not just about cutting costs—it is also about investing wisely in long-term assets. Here’s how the statements help:
- Monitoring Production Costs: If the income statement reveals that production costs are rising faster than revenue, it might indicate inefficiencies that need to be addressed.
- Investing in New Equipment: The balance sheet can signal when it is time to invest in modern machinery. For example, if the equipment is outdated and depreciating quickly, it may be time to invest in newer, more efficient models.
- Balancing Short-Term and Long-Term Goals: Both the income statement and the balance sheet provide insights that help balance the need for immediate improvements with long-term investments.
By continuously reviewing these statements, business leaders can optimize operations and ensure that both immediate and future goals are met.
The Role of Modern Tools in Financial Analysis
In today’s fast-paced business environment, technology plays a vital role in financial analysis. Over the years, I have witnessed how modern financial planning and analysis (FP&A) tools have transformed the way companies handle data. One such tool is PivotXL, which automates the collection, analysis, and reporting of financial information. Let’s explore the benefits of these tools.
Advantages of FP&A Tools
Automation and Efficiency
Firstly, FP&A tools automate data collection from various sources. This automation reduces manual errors and saves valuable time. Moreover, it ensures that the data is up-to-date, which is crucial for making timely decisions.
Real-Time Insights
Secondly, these tools provide real-time dashboards that allow business leaders to monitor key performance indicators (KPIs) as they change. As a result, you can react quickly to any shifts in the financial landscape.
Enhanced Accuracy
Thirdly, with automation comes enhanced accuracy. Financial reports generated by FP&A tools are more reliable, which means that your strategic decisions are based on solid data.
Improved Collaboration
Furthermore, these tools facilitate better collaboration among teams. For example, when the finance, sales, and operations teams have access to the same real-time data, it leads to more aligned and effective decision-making.
Clear and Concise Reporting
Lastly, modern FP&A tools generate clear reports with visual aids such as graphs and charts. These visuals make complex financial data easier to understand, especially for those who are just beginning to learn the language of finance.
Real-World Example
Consider a mid-sized manufacturing company planning to expand production capacity. By using PivotXL, the finance team quickly verifies that the balance sheet reflects a strong asset base and manageable liabilities. At the same time, the income statement shows a steady increase in revenue. Consequently, the management team can confidently approach lenders to secure the necessary funds for expansion, knowing that every financial metric supports their decision.
The Importance of Financial Literacy
It is essential to understand that financial literacy is not just for finance professionals. In my experience, the ability to read and understand financial statements is a critical skill for anyone involved in business. Let me explain why this is so important.
Informed Decision-Making
Financial literacy enables you to make decisions based on data rather than assumptions. By understanding the balance sheet and income statement, you can pinpoint areas of strength and weakness, which in turn helps you decide where to invest, where to cut costs, and how to plan for the future.
Improved Communication
When you are financially literate, you can communicate more effectively with investors, creditors, and team members. You can explain your company’s performance using clear data, which builds trust and confidence. In addition, this skill enables you to ask the right questions during meetings and negotiations.
Strategic Planning
Moreover, a solid understanding of financial statements provides the foundation for strategic planning. With this knowledge, you can set realistic goals, forecast future performance, and develop actionable plans to achieve your objectives. It also helps you anticipate potential risks and prepare for them proactively.
Risk Management
Finally, financial literacy is a key component of risk management. By understanding where your company stands financially, you can identify potential risks early on and take corrective actions before they escalate into major issues. This proactive approach is essential for long-term success.
Tips for Developing Your Financial Analysis Skills
As someone who has worked in finance for over 25 years, I encourage you to develop and refine your financial analysis skills. Below are some practical tips that have helped me throughout my career:
Start with the Basics
Begin by learning the fundamental components of the balance sheet and income statement. Focus on understanding assets, liabilities, equity, revenue, expenses, and net income. This foundational knowledge will serve as the building blocks for more advanced concepts.
Practice with Real-World Examples
It is very beneficial to study actual financial statements from companies in your industry. Many companies publish their financial reports online, which can be used as valuable learning tools. By analyzing real data, you will gain insights into how these concepts are applied in practice.
Regular Analysis
Try to make it a habit to review quarterly or annual reports. The more frequently you analyze these statements, the better you will become at spotting trends and identifying potential issues. Over time, you will develop an instinct for recognizing important patterns in the data.
Embrace Modern Tools
Adopt FP&A tools like PivotXL to streamline your financial analysis. These tools not only reduce manual effort but also provide real-time insights and accurate data. Using modern technology will allow you to focus more on strategic analysis rather than tedious data collection.
Engage with the Financial Community
Join online forums, attend webinars, and participate in local finance groups. Interacting with other professionals will expose you to different perspectives and new ideas. Moreover, sharing your experiences and challenges can further enhance your understanding.
Overcoming Common Challenges in Financial Analysis
Even with years of experience, I have seen many professionals struggle with certain aspects of financial analysis. However, with the right strategies, you can overcome these challenges. Here are some common issues and how to address them:
Complexity of Data
Financial statements can be complex, especially for beginners. Therefore, it is advisable to break down each statement into smaller parts and focus on one section at a time. For example, you can start by analyzing current assets before moving on to non-current assets.
Keeping Up with Changes
The business environment is constantly evolving, and so are financial reporting standards. To stay current, it is important to continually update your knowledge. Reading industry reports, taking refresher courses, and staying engaged with the finance community will help you keep pace with new developments.
Interpreting Trends
Sometimes, it can be challenging to interpret trends in financial data. In such cases, using visual aids such as graphs and charts can be extremely helpful. Many FP&A tools offer these features, which simplify the process of identifying patterns and anomalies.
Balancing Detail and Clarity
Finding the right balance between detail and clarity is crucial. Too much detail can overwhelm you, while too little can obscure important insights. The key is to summarize the data effectively while still capturing the essential points. With practice, you will learn to strike this balance.
Conclusion: Mastering the Language of Business
In summary, financial statements are far more than just numbers on a page—they are the language of business. With over 25 years of experience in finance, I can assure you that mastering the balance sheet and income statement is one of the most valuable skills you can develop. These statements help you understand what the company owns, how it performs over time, and how it manages cash and debt.
As you continue on your journey to financial literacy, remember these key points:
- Learn the Basics: Start with the fundamental components of financial statements and build your knowledge from there.
- Practice Regularly: Analyze real-world financial data frequently to develop your analytical skills.
- Embrace Technology: Use modern FP&A tools to automate data collection and gain real-time insights.
- Engage with Others: Participate in finance communities to learn from others and share your experiences.
- Apply Your Knowledge: Use your understanding of financial statements to make informed decisions that drive strategic success.
By following these guidelines, you will not only enhance your own skills but also contribute to the overall success of any organization you work with. Financial statements are the roadmap to making sound, data-driven decisions. Therefore, take the time to understand and analyze them thoroughly.
Ultimately, your ability to read and interpret financial statements will enable you to steer your business or career toward a prosperous future. Every decision you make will be backed by clear, data-driven insights that help mitigate risks and capitalize on opportunities.
I encourage you to embrace this journey with patience and curiosity. As you become more familiar with the language of finance, you will find that these tools empower you to achieve both personal and professional growth. Remember, every great business leader started with a deep understanding of these fundamental principles.
By now, you should have a comprehensive understanding of why financial statements matter and how to use them effectively. This guide has shown you that the balance sheet and income statement are not just regulatory documents; they are the cornerstones of strategic decision-making. With consistent practice and a commitment to learning, you too can master this language and leverage it for long-term success.
In conclusion, take pride in developing your financial analysis skills, and always strive to keep your knowledge current. Financial literacy is a journey, and each step you take brings you closer to becoming a confident and capable decision-maker. Use these insights to drive your organization forward and to secure a bright, stable future.
