


TRANSLATING MULTI-DIMENSIONAL DATA INTO TWO DIMENSIONAL SPREADSHEET
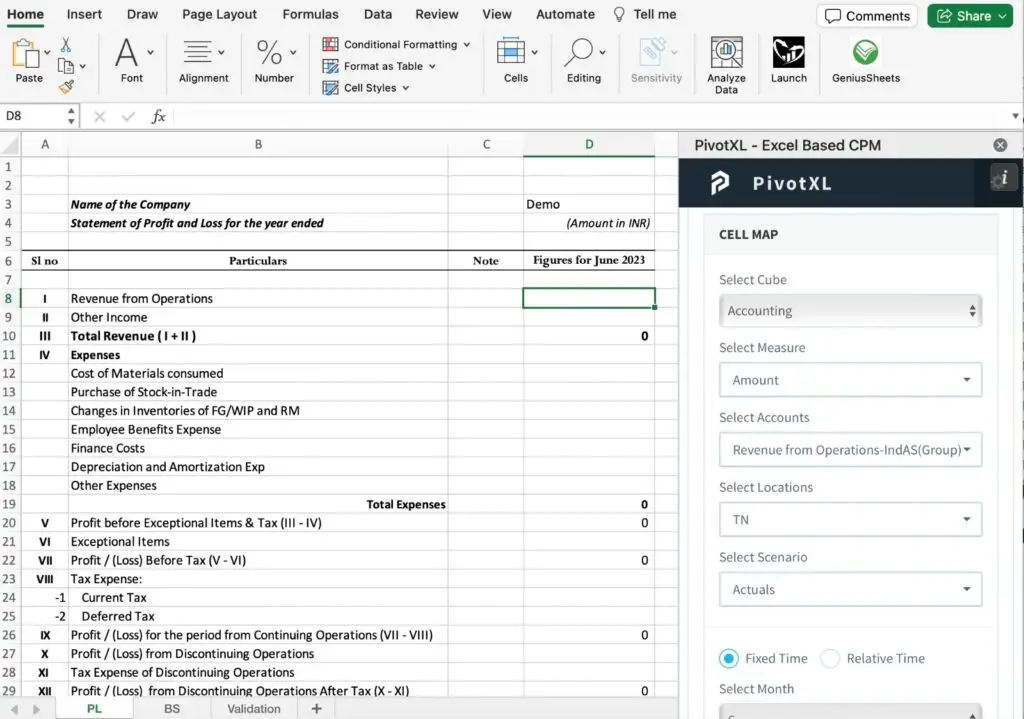
Excel, like most spreadsheet applications, is inherently two-dimensional, structured around rows and columns. To display data from a multi dimensional cube in Excel, we must effectively transform and fit this data into these two dimensions. This process is essentially about mapping – for example, aligning a cell in Excel (like A3) with a corresponding data point in the cube.
Tools like PivotXL facilitate this process. They offer features that allow for individual cell mapping as well as more advanced techniques for bulk and pattern mapping, accommodating multiple rows and columns. This kind of mapping ensures that data from the cube can be accurately and efficiently reflected in the spreadsheet.
MAPPING A MULTI-DIMENSIONAL CUBE TO A 2 DIMENSIONAL EXCEL CELL
DATA RETRIEVAL AND UPDATING: A TWO-WAY STREET
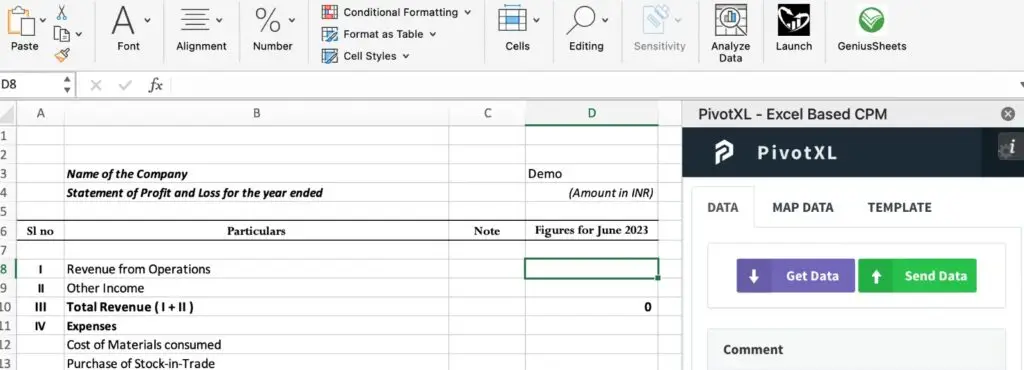
Once mapping is established, it’s crucial to have robust functionality for both retrieving data from the cube and updating it with new data. In PivotXL, this is managed through straightforward features like ‘Get Data’ for data retrieval and ‘Send Data’ for updating the cube with new spreadsheet data.
This two-way data interaction capability is essential. It ensures that the spreadsheet remains a dynamic tool, not just for data presentation but also for data analysis and manipulation, which can then be reflected back in the cube.
AFTER MAPPING,GET DATA AND SEND DATA ARE USED TO RETRIEVE AND SEND DATA TO THE MULTI-DIMENSIONAL CUBE DATABASE.
STREAMLINING KEY FINANCIAL PROCESSES
Applying these integration techniques can significantly enhance financial processes like budgeting, variance analysis, and forecasting. By leveraging the power of multi-dimensional cubes in familiar spreadsheet environments, finance professionals can achieve more accurate, efficient, and insightful data analysis.
