


📘 This post is part of the ebook: Automating Financial Planning, Reporting & Analysis in Excel
Read the full Table of Contents: Automating Financial Planning, Reporting & Analysis in Excel
⬅️ Previous Chapter: Chapter 9: KPIs and Dashboards — Turning Data into Decisions
Introduction
In today’s fast-moving financial landscape, an Excel FP&A automation system is no longer a luxury — it’s a necessity.
By integrating automation, data, and collaboration, finance teams can transform Excel from a simple spreadsheet tool into a powerful FP&A platform.
Throughout this series, we’ve explored how automation modernizes financial planning and analysis (FP&A).
Now, in this chapter, we bring it all together — showing how you can design your own Excel-centered FP&A automation system that unifies budgeting, forecasting, reporting, and analysis into one intelligent ecosystem.
1. Excel FP&A Automation in Budgeting: From Numbers to Buy-In
Budgeting is more than just entering numbers — it’s about collaboration and ownership.
In traditional Excel workflows, budget files are emailed, edited separately, and manually merged, creating confusion and delays.
However, with an Excel FP&A automation system, this process transforms dramatically:
- Shared, centralized templates connected to the chart of accounts
- Clear preparer–approver workflows
- Comments and explanations tied to each line item
- Structured submission and consolidation timelines
As a result, automation ensures that every department works together in real time. Consequently, budgets become accurate, transparent, and trusted — reflecting the ownership of the people who drive results.
2. Excel FP&A Automation for Financial Reporting: From Trial Balance to Real-Time Statements
Traditional reporting often involves hours of manual consolidation, copy-pasting, and reconciling.
Fortunately, an automated FP&A system in Excel eliminates these inefficiencies.
Here’s what changes once Excel connects to your central database or data warehouse:
- Financial statements (P&L, Balance Sheet, Cash Flow) update automatically
- Account mappings are defined once and reused
- Entity consolidation happens instantly
- Broken links and version errors disappear
Therefore, your month-end close — which once took a week — can now be completed in hours, with real-time accuracy and confidence.
3. Excel FP&A Automation for Analysis: Turning Static Numbers into Dynamic Insights
Once reporting is automated, finance can finally focus on what really matters — insight.
Automation enables Excel templates to automatically calculate key metrics like variance, margin, and KPIs whenever data updates.
Moreover, dynamic dashboards visualize these insights instantly, allowing teams to:
- Detect trends faster
- Understand the “why” behind performance
- Present findings visually to leadership
Ultimately, in an Excel FP&A automation system, finance evolves from being a reporter of the past to a storyteller of the future.
4. Month-End Close in Excel FP&A Automation: From Chaos to Control
Manual month-end close processes are often chaotic — endless reconciliations, missing files, and last-minute surprises.
Thankfully, automation introduces structure and reliability:
- Recurring checklists guide tasks and owners
- Validation rules automatically catch mismatches
- Workflow tracking monitors progress across teams
- Consolidation steps are repeatable and traceable
Consequently, the month-end close becomes a controlled, one-day process — not a weekly scramble.
5. Forecasting & Scenario Planning in Excel FP&A Automation: From Guessing to Adapting
Forecasting no longer needs to be an annual guessing game.
In an Excel FP&A automation system, it becomes continuous and adaptive.
Here’s how automation transforms forecasting:
- Actuals automatically flow in from reporting systems
- Scenario drivers (revenue, costs, demand) update instantly
- Rolling forecasts extend automatically each month
Furthermore, finance teams can test multiple “what-if” scenarios — best, base, and worst cases — and instantly see the impact on profitability, cash flow, and runway.
In short, forecasts become living, evolving models that reflect reality in real time.
6. Excel FP&A Automation Dashboards: From Data to Decisions
Dashboards bring all FP&A layers together.
They visualize company performance, promote alignment, and help everyone understand the story behind the numbers.
Using Excel-based dashboards within your FP&A automation system gives you complete control over calculations and design — while connecting to live data for real-time updates.
Modern dashboards include:
- Automatic data refreshes
- Interactive KPI tracking
- Notes and alerts for context
- Drill-down features for detailed insights
Additionally, when shared via web portals, these dashboards make financial insight accessible company-wide, helping every stakeholder make better, faster decisions.
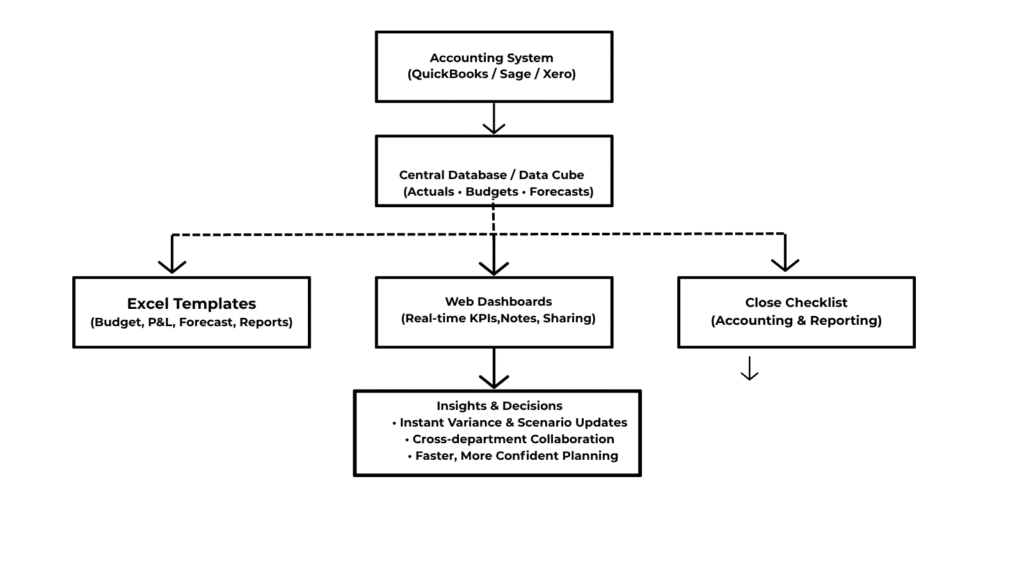
The Unified FP&A Architecture
The Excel FP&A automation system unites budgeting, reporting, forecasting, and dashboards into one cohesive ecosystem.
This modern architecture connects data, people, and processes — making Excel the intelligent front-end of your entire financial planning and analysis system.
This modern architecture connects data, people, and processes — making Excel the intelligent front-end of your entire financial planning and analysis system.
Building Your Own Excel FP&A Automation System
Here’s a step-by-step roadmap to design your own automation environment:
Evolve Continuously: Integrate rolling forecasts, predictive analytics, and AI-driven insights as your system matures.
Centralize Data: Consolidate all actuals, budgets, and forecasts into one source of truth (SQL, Power BI, or OLAP cube).
Standardize Mappings: Define a consistent chart of accounts for all reports and entities.
Automate Templates: Create Excel templates for P&L, Balance Sheet, and Cash Flow that refresh directly from your data source.
Establish Workflows: Build preparer–approver cycles, assign ownership, and set submission timelines.
Visualize and Share: Develop KPI dashboards in Excel and connect them to collaborative web platforms.
The Future of Finance Is Integrated
Automation doesn’t replace finance professionals — it empowers them.
By using Excel as the core of your FP&A system, connected to live data and automated workflows, finance teams can focus on strategy, not spreadsheets.
Moreover, when finance leads automation, the entire organization benefits — through faster insights, better decision-making, and stronger financial control.
Thus, Excel — once seen as a static reporting tool — becomes the dynamic engine driving modern FP&A.
Key Takeaway
Automation in FP&A isn’t just a tech project — it’s a strategic design philosophy.
It’s about creating systems that are:
- Repeatable: Consistent every month
- Collaborative: Connecting teams across departments
- Transparent: Ensuring accuracy and traceability
- Scalable: Growing with your business
With an Excel FP&A automation system, finance evolves from reporting the past to shaping the future.
Conclusion
Bringing it all together, designing your Excel FP&A automation system means rethinking how finance operates.
By unifying budgeting, reporting, forecasting, and analysis into one intelligent framework, you create a finance function that’s faster, smarter, and more connected.
Ultimately, Excel remains the trusted heart of finance — now supercharged by automation and powered by live data.
Platforms like PivotXL make this transformation even easier by connecting Excel to centralized databases, automating workflows, and delivering real-time insights — all without forcing finance teams to leave the tool they know best.
This is the future of financial planning and analysis: a world where finance leads transformation, not paperwork.
With the right platform, such as PivotXL, your Excel-centered FP&A automation system can become the foundation for a truly data-driven, collaborative, and agile finance function.

