
In this piece, we explore how making dashboards shareable across different stakeholders can be instrumental in deriving deeper insights from the data. While visual representations in dashboards succinctly display data, they often don’t explain the underlying reasons for observed trends or anomalies. This is where the ‘5 Whys’ technique becomes invaluable.
The ‘5 Whys’ is a simple yet powerful method for root cause analysis. It involves asking “Why?” repeatedly until the fundamental cause of a problem is identified. The first answer provides a surfacelevel understanding, but as we progress with each subsequent ‘Why?’, we delve deeper, uncovering the core issue at hand.
For this analytical method to be effective, there must be a platform for stakeholders to engage in discussion and document their insights. This is crucial not only for immediate analysis but also for future reference, such as in board presentations or strategic reviews.
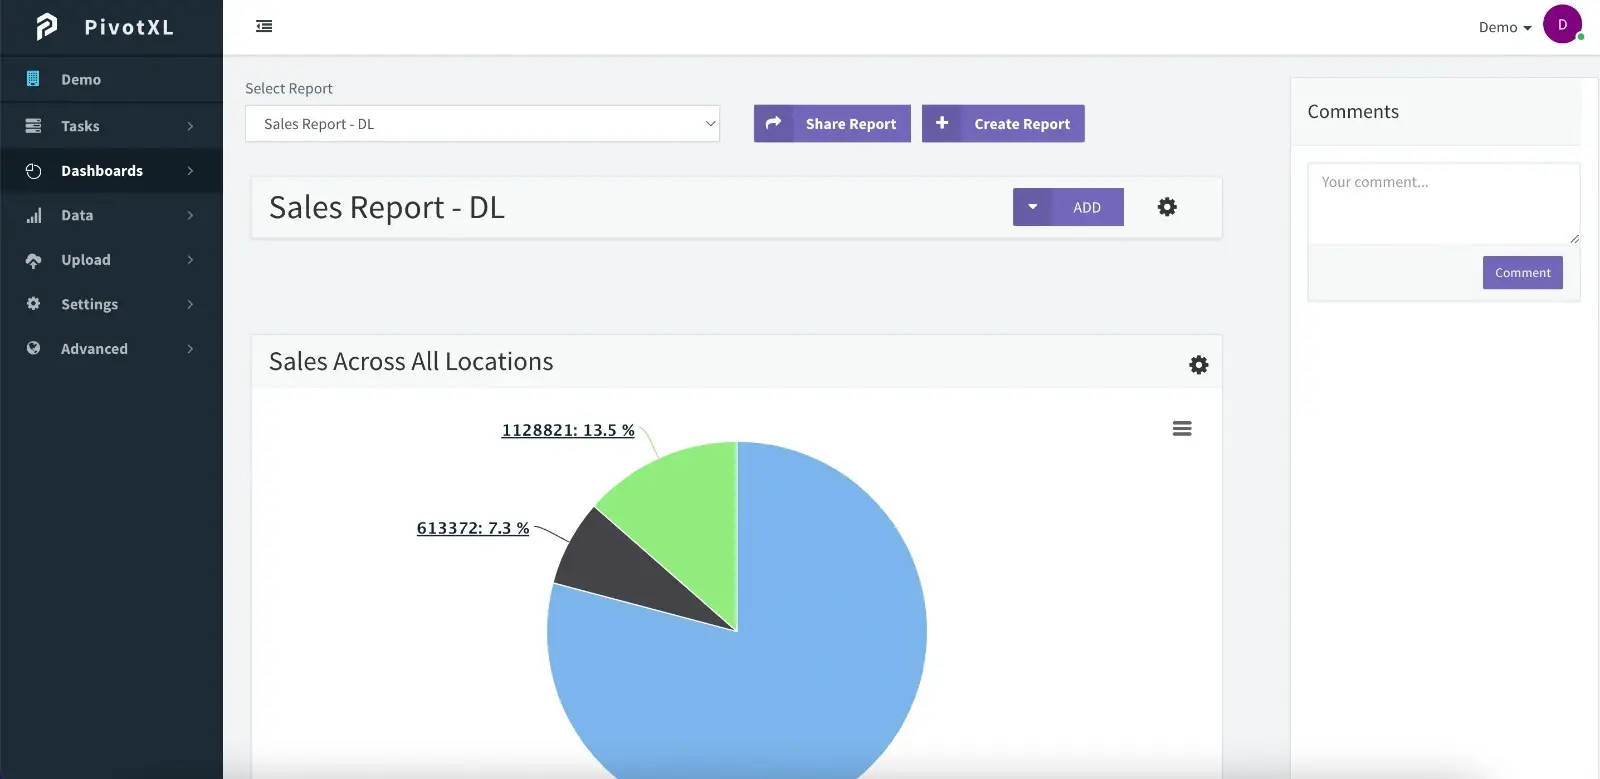

This interactive process is more than just a means of understanding data; it is a gateway to strategic action. As stakeholders engage with the data and contribute their perspectives, the insights gained can be documented directly within the dashboard. This living record of analysis and decision-making forms a valuable resource for guiding future strategy and implementing course corrections.
Shareable dashboards in PivotXL thus become more than just tools for data representation; they transform into dynamic platforms for collaborative analysis and strategic development. By leveraging the ‘5 Whys’ method within these dashboards, organizations can foster a culture of inquisitive analysis, ensuring that every data point is not just a number, but a story waiting to be understood and acted upon.
