


PivotXL Limited Views and User Access ensure data security and streamline operations by restricting access based on user roles. Regular users can only access tasks assigned by admin users and view reports shared with them. This approach not only protects sensitive financial data but also ensures operational efficiency. Admins maintain control over data access and manage report sharing, enabling secure and effective user workflows.
Key functionalities available for limited-view users include:
- Task execution as assigned by admin users.
- Viewing and analyzing reports shared by admin users.
- Restricted access to ensure data security and prevent unauthorized modifications.
This controlled access empowers organizations to maintain data integrity while providing users with essential insights.
Managing User Access in Excel Reports
The PivotXL Excel add-on enhances the user experience by offering essential features for simplified data handling. With PivotXL Limited Views and User Access, non-admin users can securely work with financial data without extensive technical expertise. This controlled access ensures that users can perform their tasks efficiently while maintaining data security. By leveraging PivotXL Limited Views and User Access, organizations can streamline operations and protect sensitive information.
Key Features of Limited Views in Excel:
- Controlled Data Access: Users can view financial reports for all months but cannot modify restricted data.
- Mapped Cell Insights: Selecting a cell reveals its data mapping details, but only admins can make modifications.
- Secure Data Import & Export: Users can import values using the Get Data option, but updates via Send Data require admin permission.
- Commenting for Clarity: Users can add contextual comments when making data updates to track changes efficiently.
- Lock & Hide Features: The Lock Cell feature prevents unwanted updates, and the Hide Empty Rows option keeps reports clean.
- Restricted Template Settings: Admins can control permissions for sending and retrieving data, ensuring only authorized users can make modifications.
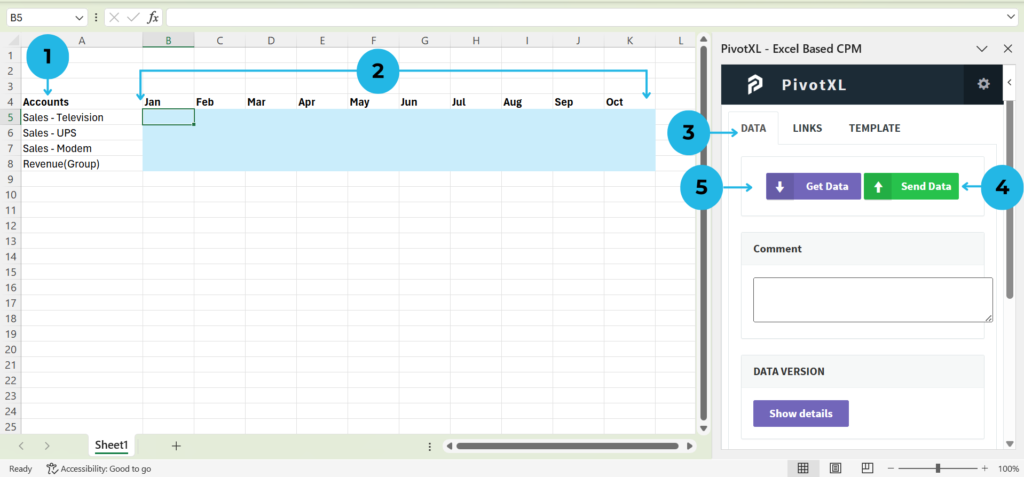
1.Displays a comprehensive list of account names within the report.
2.The report showcases financial data for all months of the year.
3.After logging into the PivotXL Excel add-on, users can access the “DATA” section, which includes features such as data import, export, and detailed data visualization.
4.Edit report values and click Send Data to sync changes, with admin control over this feature.
5.Click Get Data to import account values into pre-mapped cells.
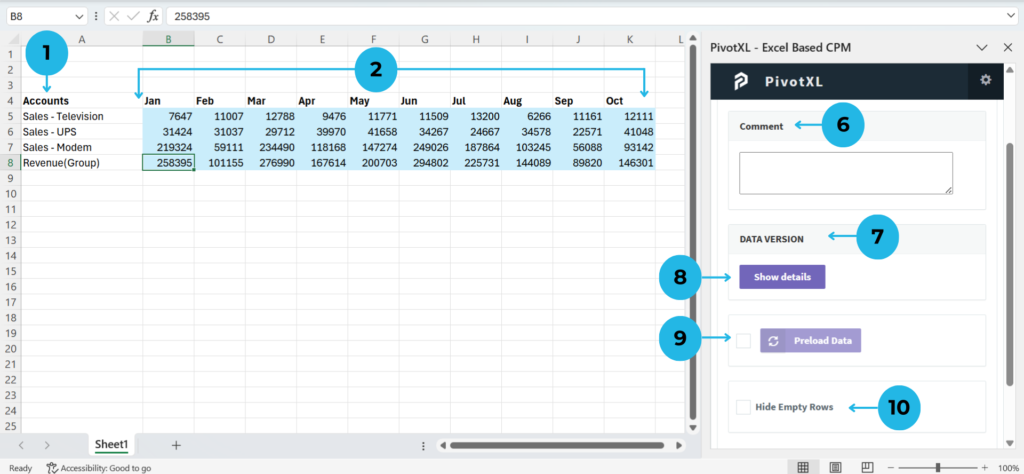
6.The imported data will populate the mapped cells, and you can use the Comment Section to add notes or explanations whenever you update the values by clicking the Send Data button. This helps to provide context for any changes made.
7.The DATA VERSION section displays detailed account information for each cell, including the ability to drill down into the Tag Group for the latest data version.
8.Click the Show Details button to reveal the specifics of the selected cell, such as the January Revenue(Group) value, giving you more context about the data.
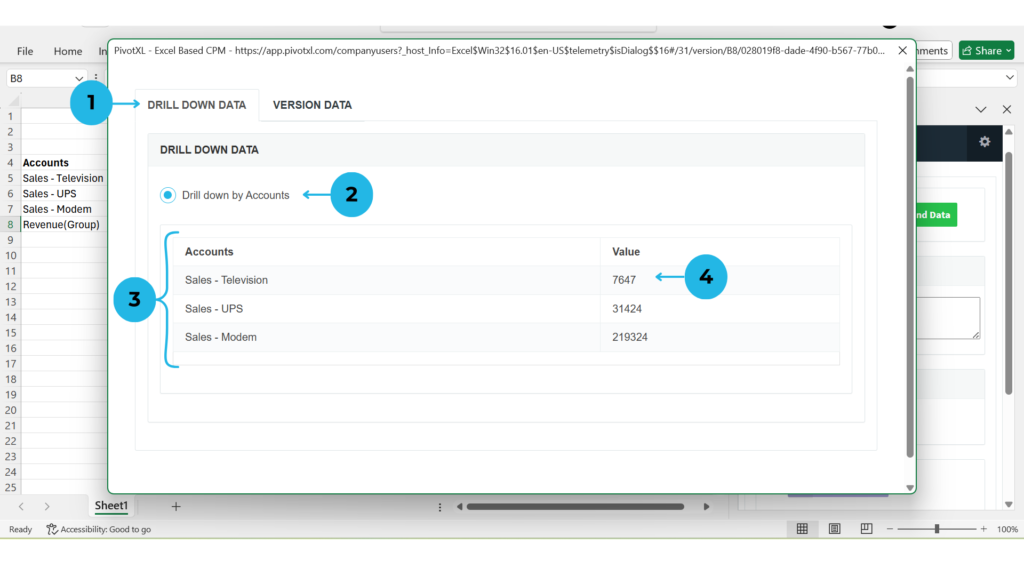
1. A new pop-up shows the drill-down data for the selected account.
2. Drill-down is available only for Tag dimensions (e.g., Group); other dimension members display data versions.
3. The Accounts section lists accounts based on the selected cell value
4.Click the value to view detailed drill-down data.
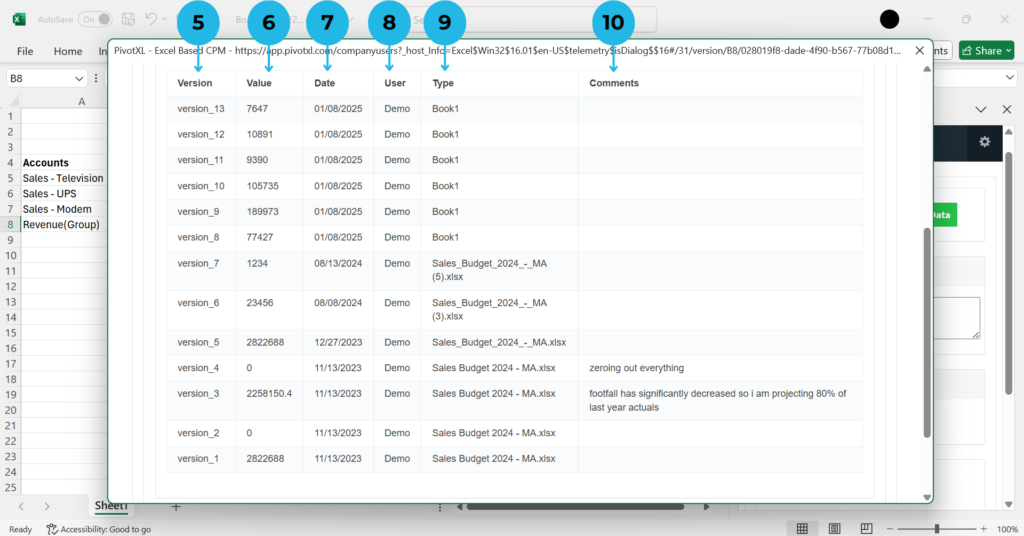
5. Shows the list of updated versions.
6. Displays the updated account values.
7.Shows the date the account value was updated.
8.Lists the user who updated the version.
9.Indicates which file was used to update the version.
10.Shows any comments related to the update.
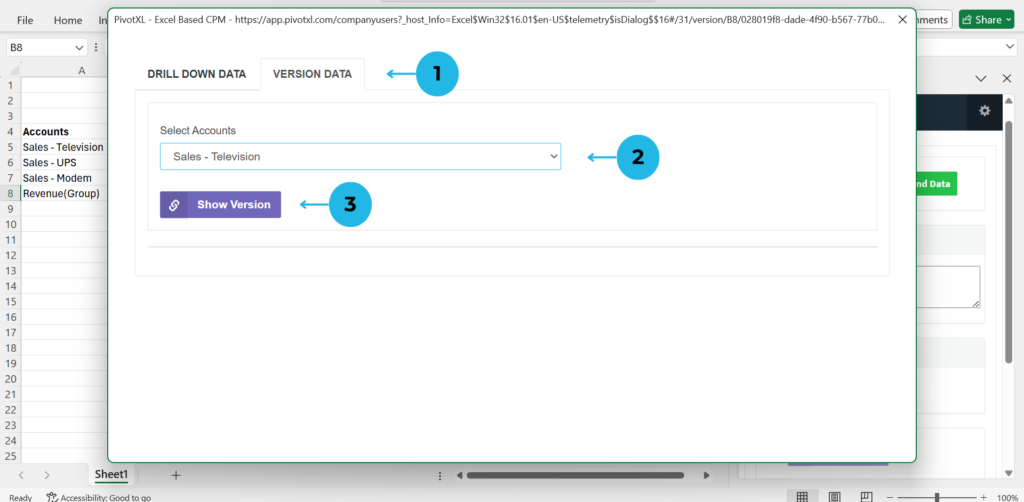
1.Click on “VERSION DATA” to view the versions of accounts.
2.Select Account Name from the drop-down list under “Select Accounts.”
3.Click “Show Version” to display the list of versions.
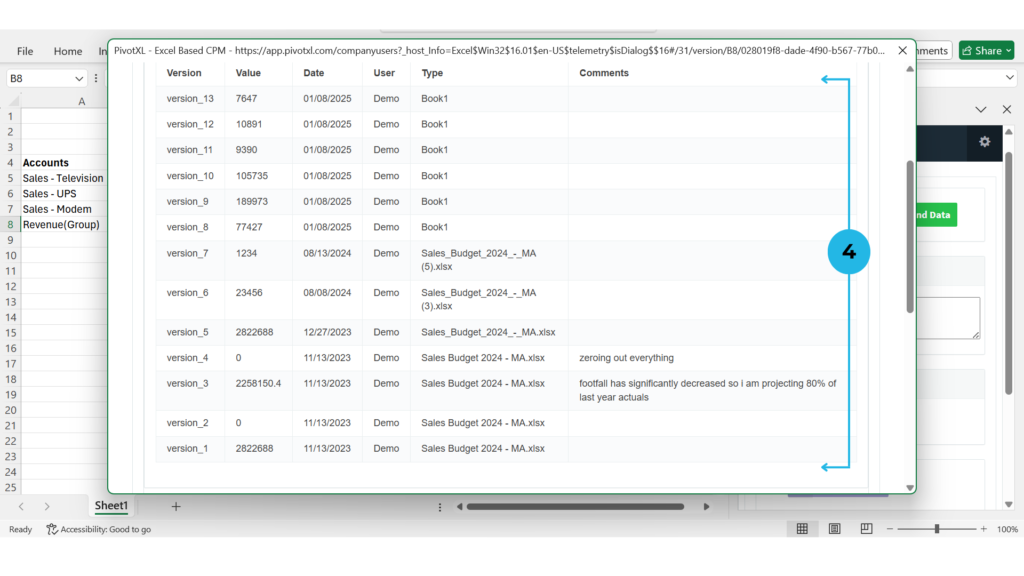
4.The Version List page will appear, showing version, value, date, user, and comments.
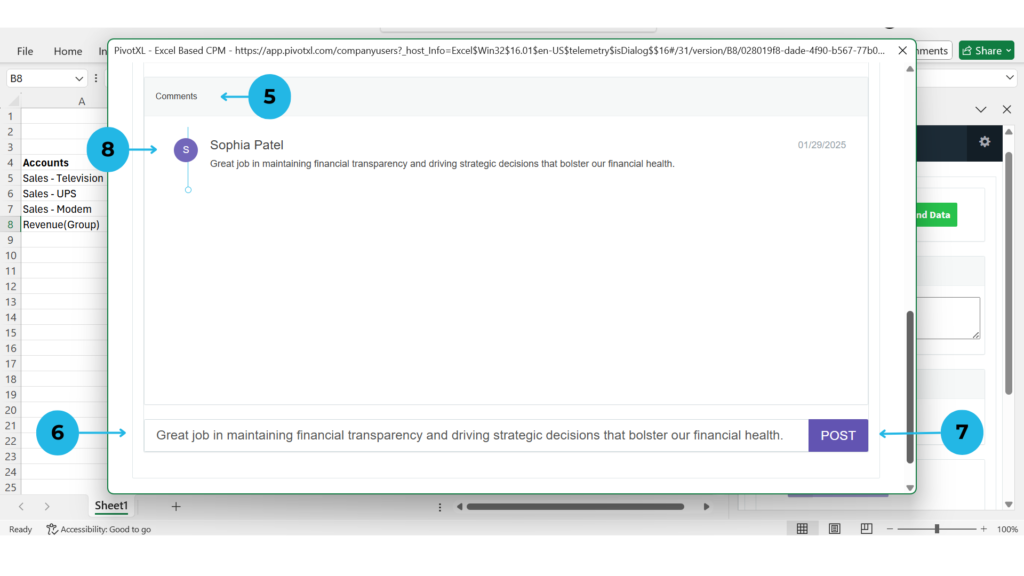
5.In the Comments Section, you can post any notes or instructions.
6.In the Type Box, enter your comment.
7.Click “POST” to submit your comment.
8.The User who posts the comment will be displayed under the user column.
9.Utilize the Preload Data feature for bulk data import. Enable the option by checking the box, and the data import process will run in the background. Once completed, you will receive an email notification confirming the successful import.
10.The Hide Empty Rows option allows users to automatically hide rows that contain no data. This helps in maintaining a cleaner report, especially when dealing with large datasets, ensuring only relevant rows are visible.
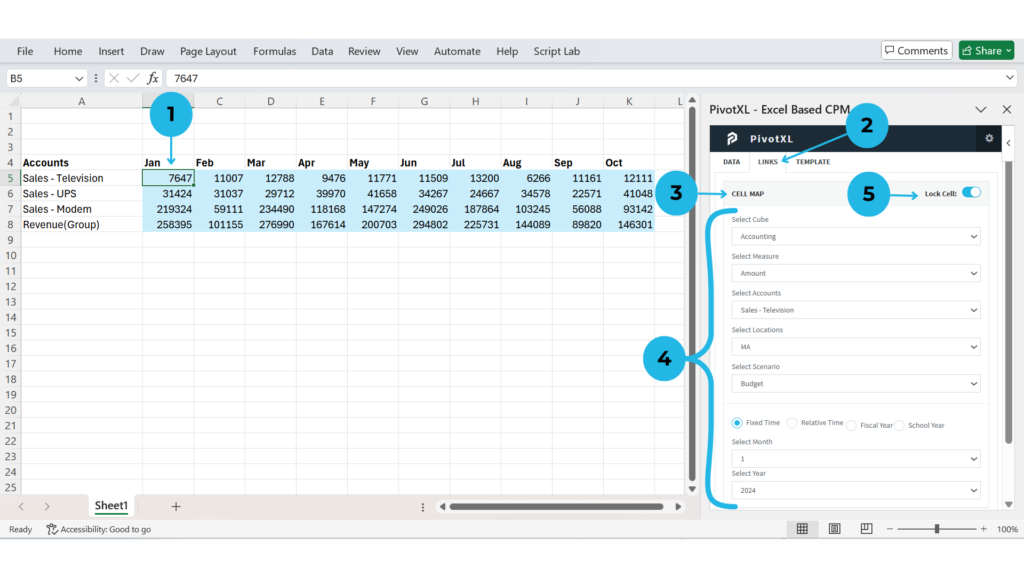
1.In the Excel report, select a cell to view the mappings of the cell value for deeper insights.
2.Click on the Links Tab to display the mapping details, giving you a clear view of how the data is connected.
3.The CELL MAP will show mapping details but is read-only for most users. Only Admin users have access to modify these mappings.
4.The mapping will display key information including Cube, Dimensions, and Time, allowing for a comprehensive view of the data structure.
5.The Lock Cell feature lets you lock a particular cell to prevent updates during data refresh. Enable the Lock Cell option to ensure that the cell remains unchanged. Note: Non-admin users do not have access to use this option
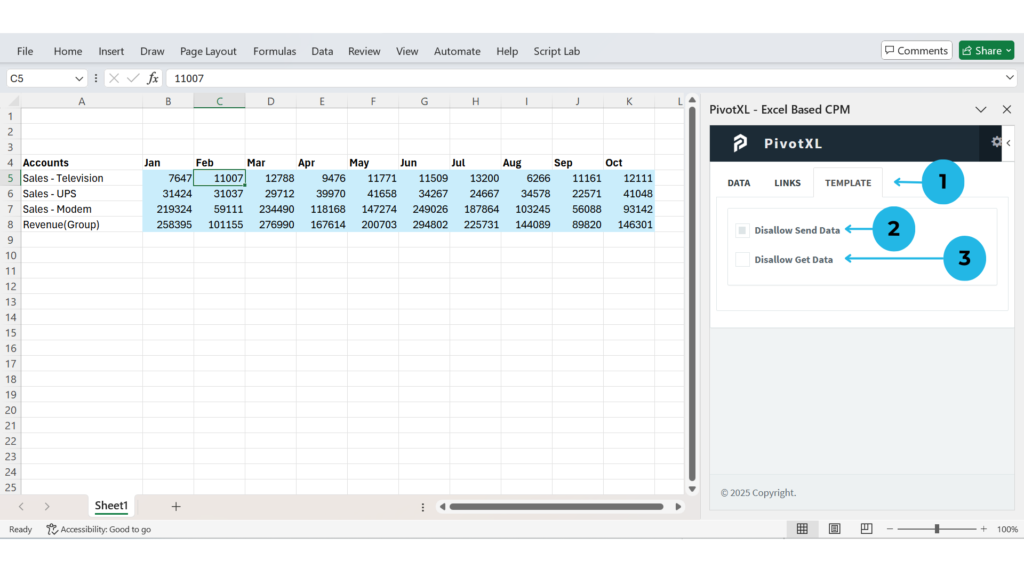
1.Click on the Template Tab to access the settings for data handling and permissions.
2.The Disallow Send Data option, when enabled, prevents users from updating values and using the Send Data feature in the DATA section. If disabled, users are allowed to update and send data. This feature is preset for Admin users to grant permission to use the Send Data option.
3.Similarly, the Disallow Get Data option restricts users from accessing the Get Data feature. Admin users have the authority to grant or revoke access to this feature for other users.
Limited Views for Tasks in PivotXL
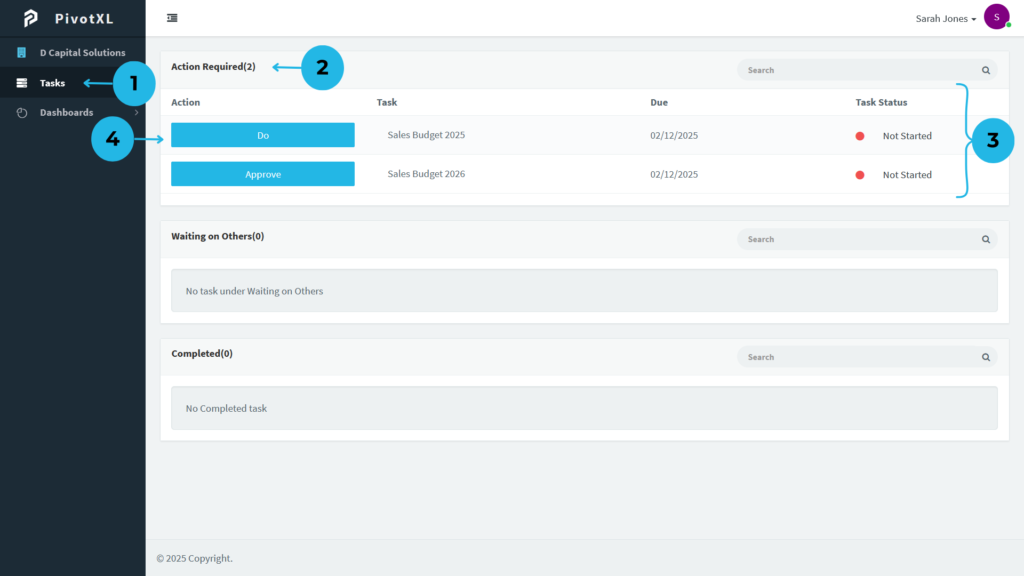
1.Log in with your user account and navigate to the left menu. Click on Tasks to access your task list.
2.In the Action Required section, you will see the tasks assigned to you. Currently, two tasks are displayed for the user.
3.The Task Details section is divided into four key areas:
- Action: Provides options for completing the task.
- Task: Displays the name of the task.
- Date: Shows the creation and assignment date of the task.
- Status: Displays the task’s current status with color indicators for easy identification.
4.To proceed with the task, click on the DO button in the Action section.
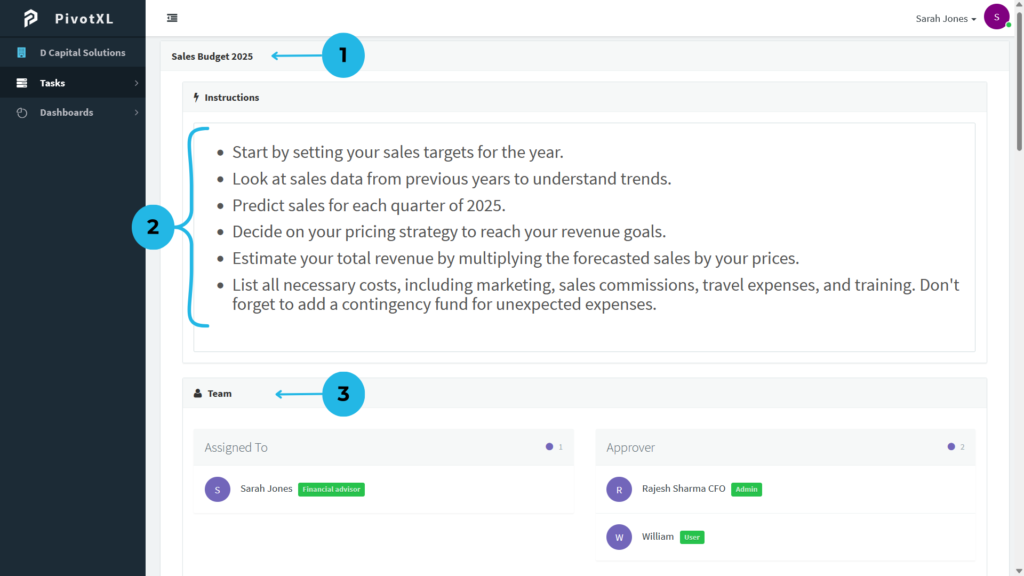
1.A new pop-up opens displaying the task details, including the name of the task to help you clearly identify the task you’re working on.
2.The Instructions section provides clear task instructions to guide you through completing the task.
3.In the Team section, you can view the details of the team members involved in the task, including the assignee and approver, but not modify them.
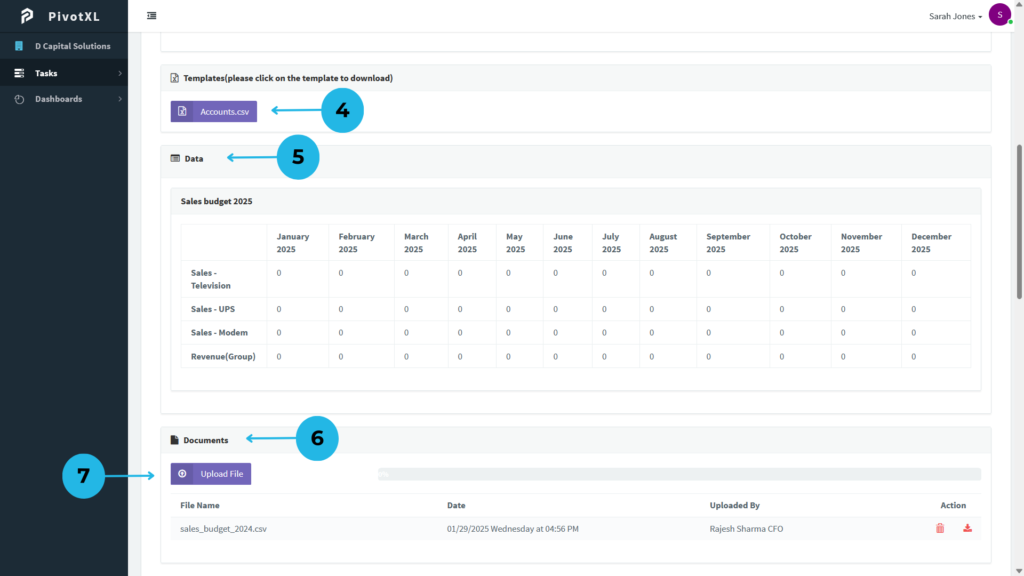
4.The Template section allows you to easily download the task template. Simply click the file name to download it for reference.
5.In the Data section, the task table is available, and if granted access by the admin, you can edit the table values directly.
6.The Documents section displays important reference documents for the task. You can download these by clicking the download icon or delete old documents if necessary.
7.Upload new documents by clicking the Upload File button to keep everything up to date.
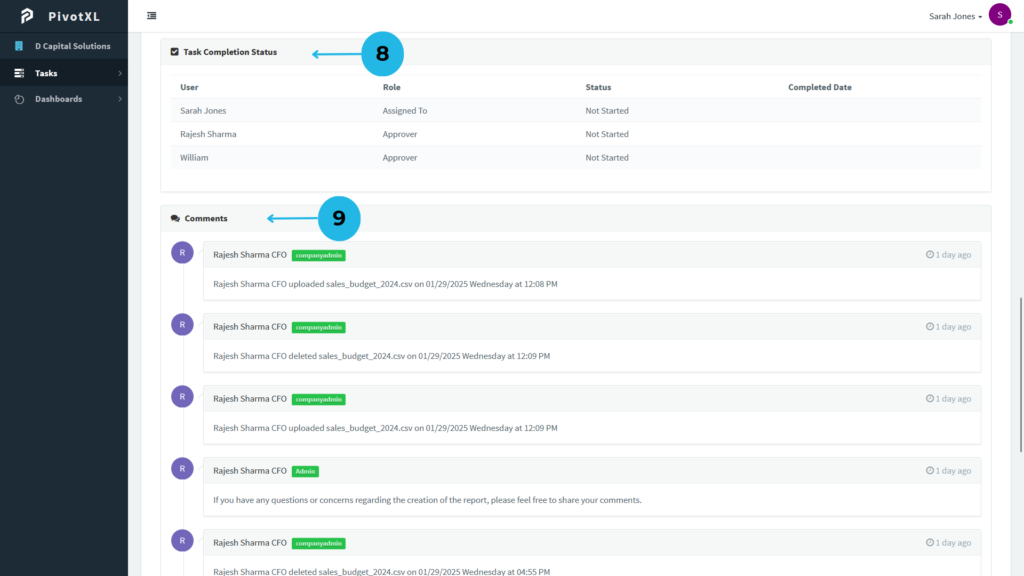
8.The Task Status Completion section shows the task’s current progress, including the user name, role in the task, task status, and completion date.
9.The Comments section displays a log of task-related comments, allowing for easy communication between team members.
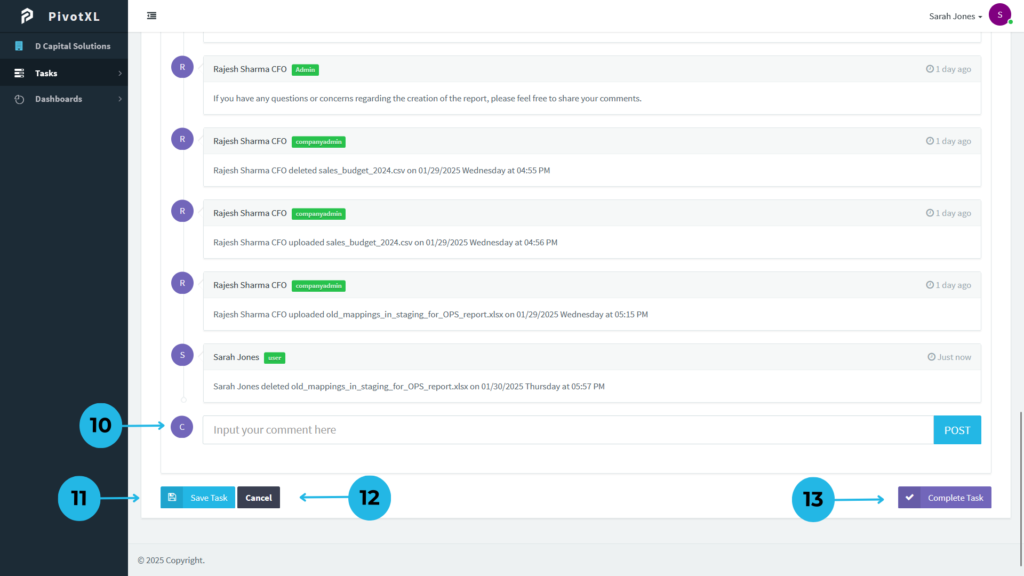
10.You can post comments by typing in the comment box and clicking the POST button to share your thoughts or updates.
11.Save your progress on the task anytime by clicking the Save Task button, especially if you need to take a break and resume later.
12.To avoid making changes, simply use the Cancel button to discard any modifications.
13.After completing the task, click on the Complete Task button to confirm the task is finished. You’ll be prompted with a confirmation message to finalize the process.
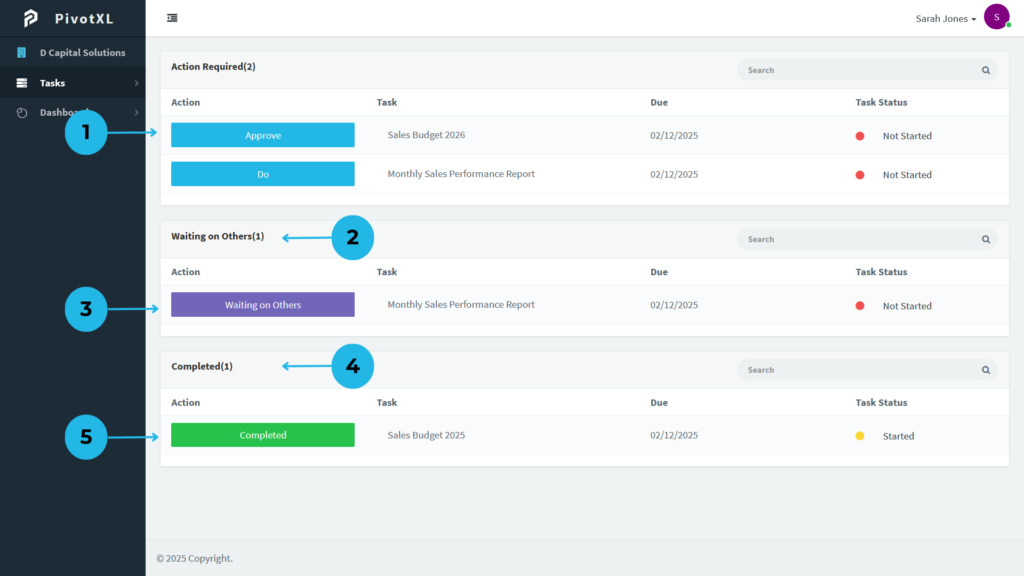
1.Click on the Approve button in the Action Required section to approve the task. Unlike the DO Action, the Approve action doesn’t require you to complete the task; your responsibility is to ensure the task is done correctly by others.
2.Waiting on Others section appears when you’ve completed your part of the task, but there are additional assignees and approvers. The task status will update to complete once all users have finished their respective parts.
3.The Action section will display the message “Waiting on Others”, indicating that the task is pending completion by others, and no further actions can be taken.
4.In the Completed section, only tasks that are fully completed will appear, giving you a clear view of finished work.
5.The Action section will show the message “Completed” once the task is finalized. At this point, no further actions can be performed on the task.
Restricted Access in PivotXL Web Dashboard
PivotXL Limited Views and User Access ensure secure and controlled interactions within the Web Dashboard, allowing users to access reports while maintaining data integrity. With restricted access, users can view and update information based on admin-defined permissions.
Key Features of PivotXL Limited Views and User Access
1. Secure Report Viewing with PivotXL Limited Views
Users can log in and navigate to the Dashboards section to access their reports. They can select a report from the Select Report dropdown list, with the report name displayed at the top for easy identification.
2. Controlled Data Editing for User Access Management
If permitted, users can click the Edit button to modify table values. For instance, updating Sales-Ups from 41,288 to 52,364. However, editing rights are controlled by admins on a per-report basis. After making changes, users can click Save to update values or Cancel to discard edits.
3. PivotXL Limited Views for Commenting and Collaboration
Users can engage in discussions by posting comments in the Comments section. These comments are visible to all users with access to the report, ensuring seamless collaboration. Additionally, users can reply to comments using the Share icon for further interaction.
4. Data Security with Limited Views in PivotXL Charts
While chart modifications are restricted, users can download charts in multiple formats such as PNG, JPEG, PDF, and SVG, allowing them to reference and share visual data as needed.
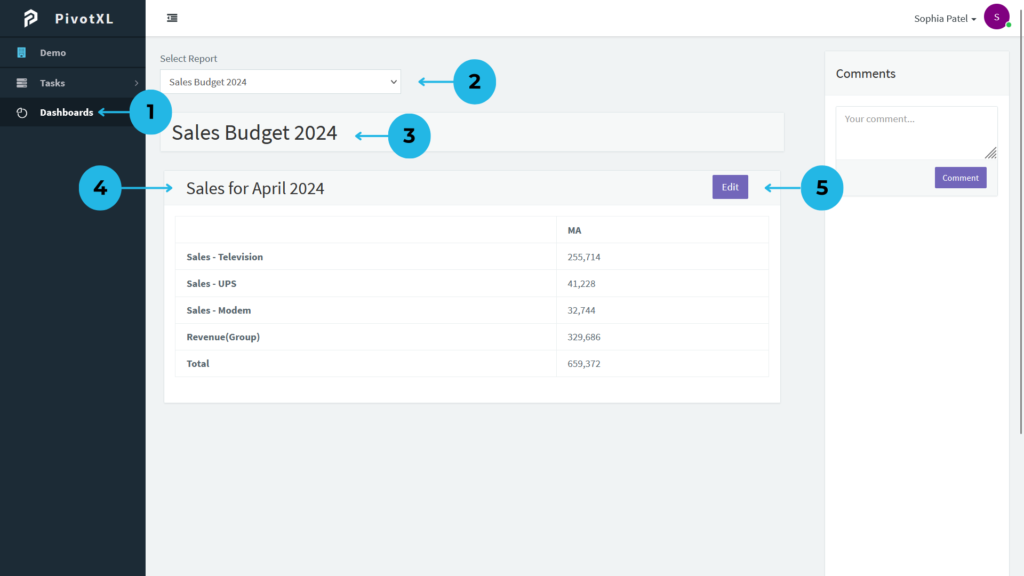
1.Log in with your user account and navigate to the left menu. Click on Dashboards to access your reports.
2.Select the report from the Select Report dropdown list to load the desired report.
3.The Report Name will be displayed at the top for easy identification.
4.The report table will be visible, showcasing data entries.
5.Click the Edit button to update values in the table. The Edit option is provided by the admin based on access controls. Admins can modify access rights for users on a per-report basis.
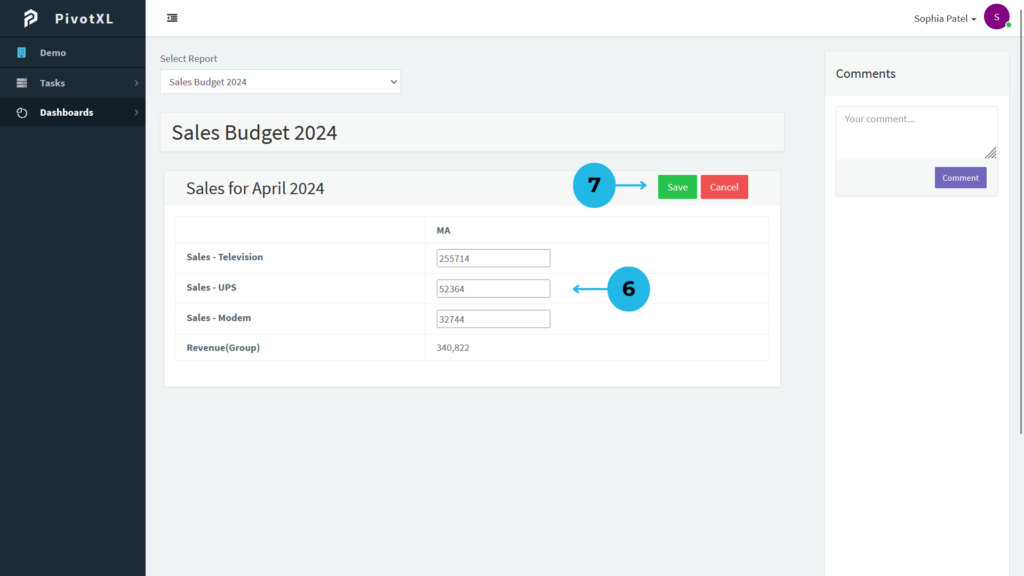
6.Change table values as needed. For instance, update Sales-Ups from 41,288 to 52,364.
7.Click the Save button to update the table values. If no changes are required, click Cancel to discard edits.
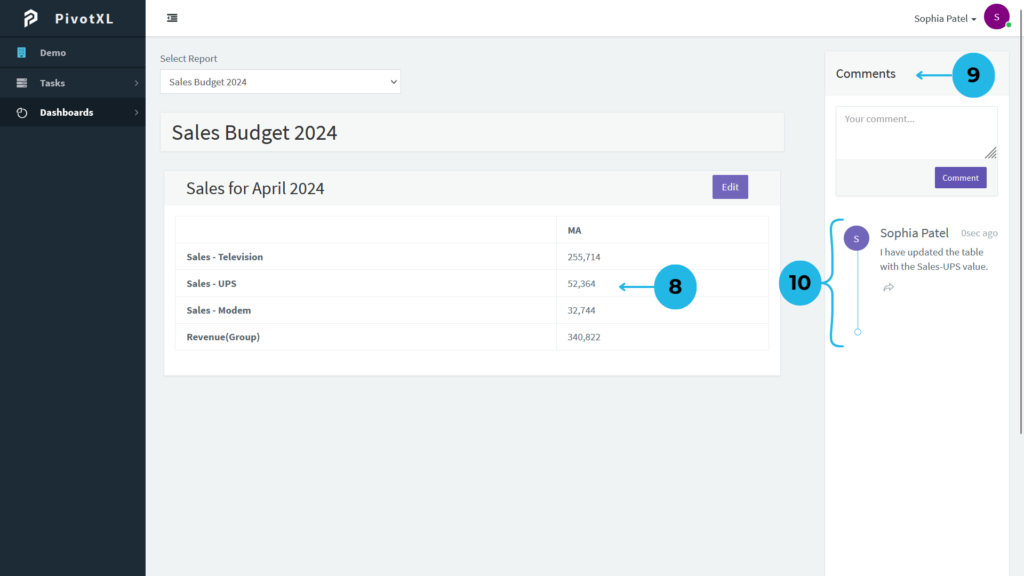
8.Upon successful save, the value is updated in the account.
9.In the Comments section, users can post comments related to the report. These comments will be visible to all users viewing the report.
10.Add your comment and post it. The posted comment will display immediately. Reply to comments by clicking the Share icon button for further interaction.
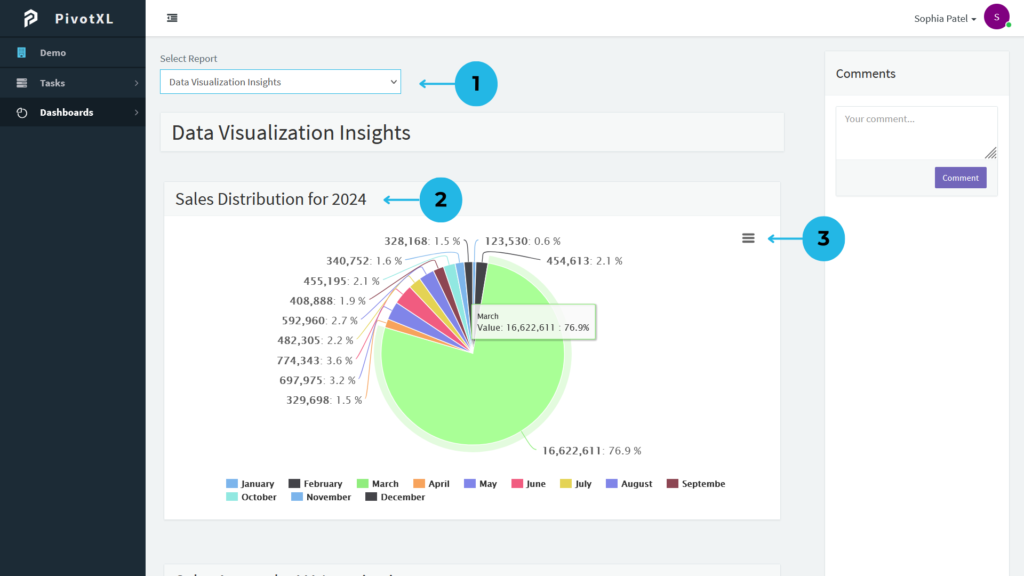
1.Select the report from the Select Report dropdown list to load the desired report seamlessly.
2.The Report Name will be prominently displayed at the top for easy identification.
3.Chart Modification is restricted for users, but they have access to download the chart in various image formats such as PNG, JPEG, PDF, and SVG for easy reference and sharing.

