


Introduction
Sensitivity analysis in Excel is a powerful technique that helps users understand how changes in input values affect the outcomes of a model. Moreover, it is widely used in financial modeling, risk assessment, and decision-making. Additionally, it allows users to evaluate different scenarios and assess potential risks. In this guide, we will walk you through the process of performing sensitivity analysis in Excel using Data Tables and Scenario Manager. So, let’s get started!
What is Sensitivity Analysis?
Sensitivity analysis not only examines how different input values influence a specific output but also helps users gain deeper insights into how changes in variables affect outcomes. Moreover, it allows users to test multiple scenarios, making it easier to assess potential risks and opportunities. As a result, businesses can make well-informed decisions based on data rather than assumptions. Furthermore, by understanding the impact of different variables, organizations can refine their strategies, improve financial models, and enhance overall efficiency. In addition, sensitivity analysis provides a structured approach to evaluating uncertainties, ensuring that businesses remain prepared for various situations. Therefore, incorporating sensitivity analysis into decision-making processes leads to more accurate predictions and better long-term planning.
Learn more about sensitivity analysis in Excel and discover how it can help you evaluate different scenarios, identify risks, and make informed decisions.
Why Use Sensitivity Analysis in Excel?
- First and foremost, it helps in decision-making by providing insights into how different variables impact outcomes, making it easier to choose the best option.
- Moreover, it identifies risks and opportunities by analyzing different scenarios, allowing businesses to prepare for uncertainties.
- In addition, it improves accuracy in financial modeling by considering multiple factors, ensuring more reliable predictions.
- Lastly, it saves time by automating scenario testing, which speeds up the analysis process and reduces manual effort.
Methods of Sensitivity Analysis in Excel
To perform sensitivity analysis in Excel, you can use different methods, including:
- Data Tables
- Scenario Manager
- Goal Seek
Now, let’s explore these methods in detail.
Sensitivity Analysis Using Data Tables
Data Tables in Excel allow you to analyze the effect of one or two variables on a formula’s result. Therefore, follow these steps to create a Data Table:
Prepare the Data
- Open Excel and enter your model, including the formula for the output you want to analyze.
- Identify the input variable(s) that you want to test.
Enter the following data into an Excel worksheet:
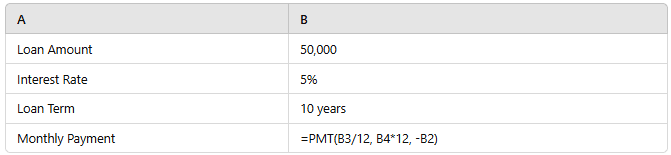
Set up a range of interest rates in Column D and reference the monthly payment formula:
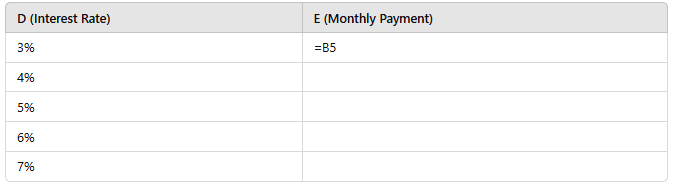
One-Variable Data Table
- List different values of the input variable in a column.
- In the adjacent column, reference the formula that calculates the result.
- Next, select the table range and go to Data > What-If Analysis > Data Table.
- In the Column Input Cell, select the input variable’s cell and click OK.
Two-Variable Data Table
- List one set of input values in a row and another set in a column.
- In the top-left cell of the table, enter the formula that calculates the output.
- Then, select the entire table and go to Data > What-If Analysis > Data Table.
- In the Row Input Cell, select the first variable.
- In the Column Input Cell, select the second variable and click OK.
Sensitivity Analysis Using Scenario Manager
Scenario Manager allows users to create multiple scenarios and compare results easily. Therefore, follow these steps:
Open Scenario Manager
- Go to Data > What-If Analysis > Scenario Manager.
- Click on Add to create a new scenario.
Define Scenarios
- Name the scenario (e.g., Best Case, Worst Case, Base Case).
- Select the input cells whose values will change.
- Enter different values for each scenario and click OK.
Generate a Summary Report
- Click on Summary and select the result cell.
- Excel will generate a comparison table showing how the output changes based on different scenarios.
Sensitivity Analysis Using Goal Seek
Goal Seek is useful for finding the required input value to achieve a specific result. So, here’s how you can do it:
Open Goal Seek
- Go to Data > What-If Analysis > Goal Seek.
- In the Set Cell, select the result cell.
- In To Value, enter the desired outcome.
- In By Changing Cell, select the input cell.
- Finally, click OK, and Excel will adjust the input value to reach the target result.
Conclusion
Sensitivity analysis in Excel is essential for understanding how different inputs impact a model’s outcome. By using Data Tables, Scenario Manager, and Goal Seek, you can efficiently analyze multiple scenarios and evaluate the effects of changing variables. As a result, you can identify potential risks, optimize decision-making, and improve the accuracy of financial models. Moreover, whether you’re working on business forecasting or risk assessment, mastering sensitivity analysis allows you to gain deeper insights and make well-informed, data-driven decisions with confidence. Additionally, by applying these techniques, you can enhance your ability to predict outcomes and adapt to various financial situations more effectively.
For more Excel tutorials, be sure to explore our latest guides on PivotXL and enhance your spreadsheet skills today!
