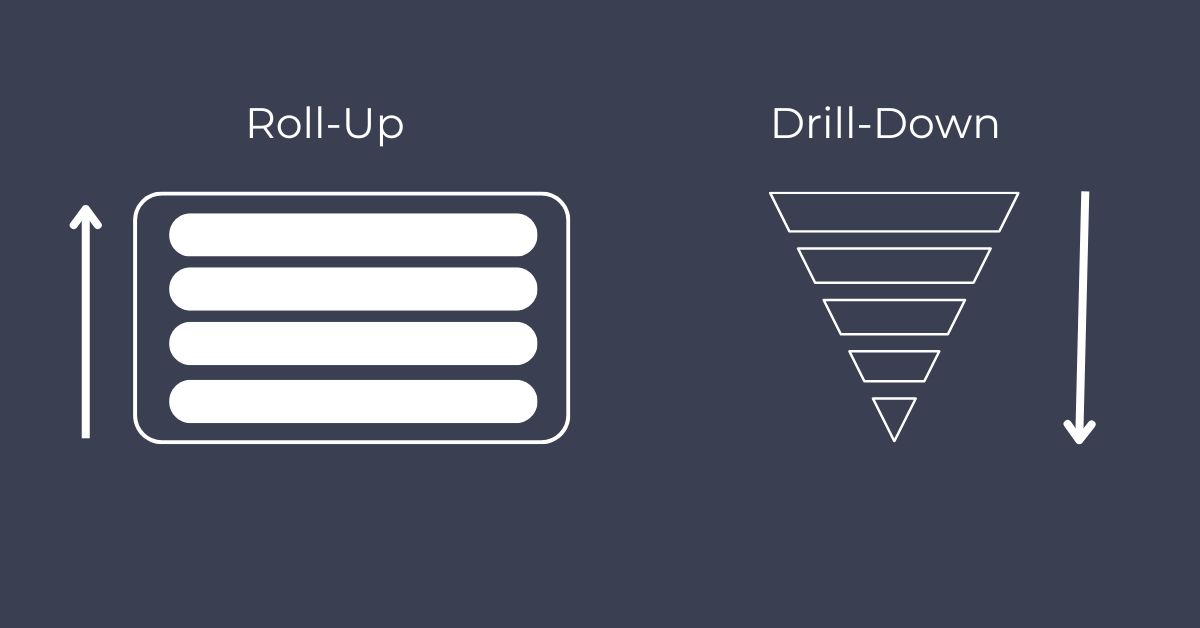
Often, management teams require high-level information that also prompts questions about specific details. Management Information Systems (MIS) are designed to present information in a way that makes this possible. This is where storing data in a data cube format, complete with built-in roll-ups and drill-downs, becomes especially valuable.
In this article, we’ll explore roll-ups and drill-downs from a use case perspective.
Why Do We Need Roll-Ups and Drill-Downs?
Imagine you’re a decision-maker tasked with analyzing your company’s sales data, covering different products, regions, and even sales teams. Sometimes, you need a broad overview, while at other times, you need to dive into specific details. Roll-ups and drill-downs give you control over this view, allowing you to quickly identify what’s working and where improvements may be needed.
Roll-Up: Seeing the Big Picture
When you “roll up” data, you’re grouping detailed information into a summary. For example, sales data for various products across locations might be grouped by product line or region, managed by specific product or sales teams.
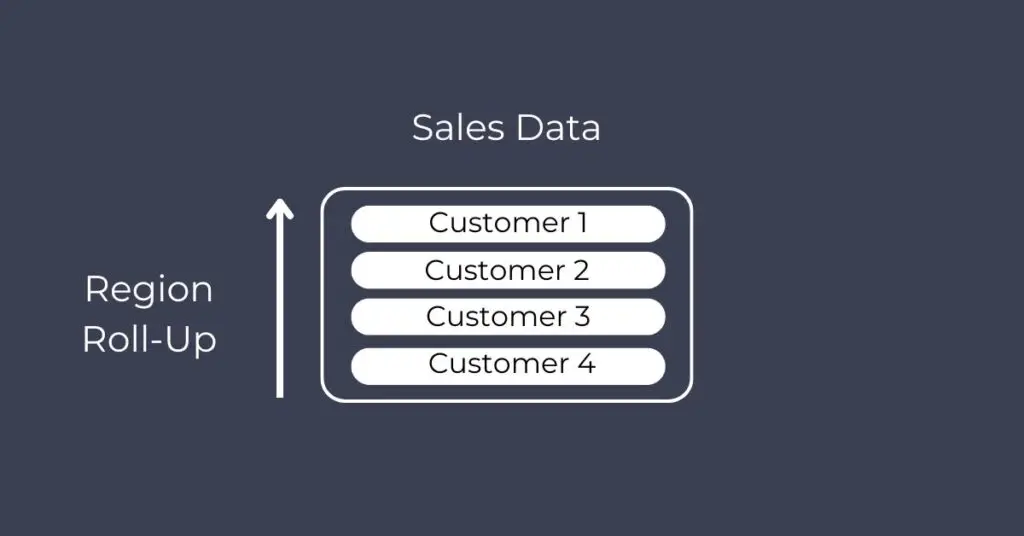
This high-level view is essential for assessing overall trends. For instance, rolling up data allows you to view the performance of a specific product line across all regions, helping you understand broader trends without getting bogged down by intricate details.
Drill-Down: Getting to the Core of Issues
Sometimes, high-level data only tells part of the story. If you identify an underperforming product line, drilling down allows for further investigation by examining specific products or locations.
Drill-downs make it easy to pinpoint the root of issues. For example, if a region’s sales are lower than expected, drilling down into specific cities or products within that region can reveal whether the issue is widespread or isolated.
Using Roll-Ups and Drill-Downs with Data Cubes
Data cubes, which store data across multiple dimensions, are essential for efficient roll-ups and drill-downs. Each dimension—such as time, product, or region—can be viewed broadly or in detail, helping create a clear and comprehensive picture.
Roll-Up by Product Group and Region
View total sales by product group across different regions to assess the overall success of each product line.
Drill-Down by Specific Product and Location
After identifying that a product group underperforms in one region, drill down further to see which specific products are lagging and whether the issue is isolated to certain cities or spans multiple locations.
PivotXL: Powering Roll-Ups and Drill-Downs for MIS
Tools like PivotXL streamline the setup and management of roll-ups and drill-downs within data cubes, making it easy to customize views. You can define roll-ups for each dimension, such as products, regions, and time periods, and view data in rolled-up or drilled-down formats based on your needs. This flexibility allows you to adapt your analysis on the go, ensuring your data always provides actionable insights.
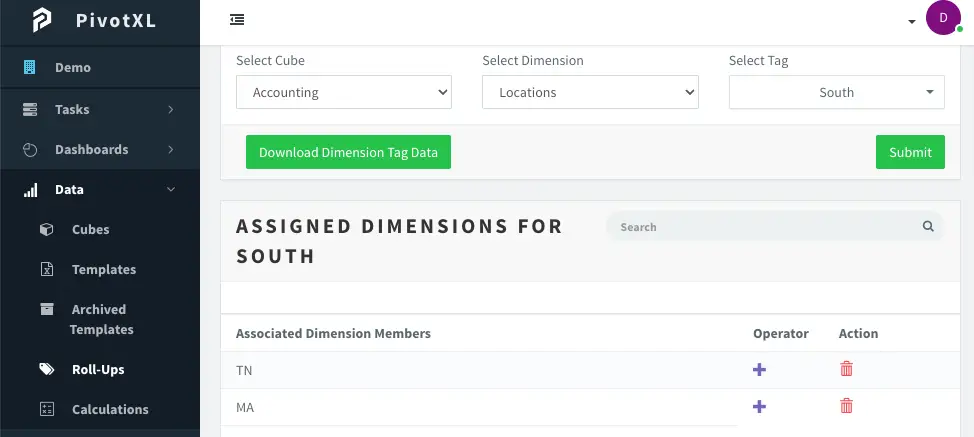
With the roll-ups in place, users can seamlessly navigate through hierarchical data to uncover detailed insights. The web application offers an intuitive interface for visualizing these layers, making it easy to explore summaries and granular details alike.
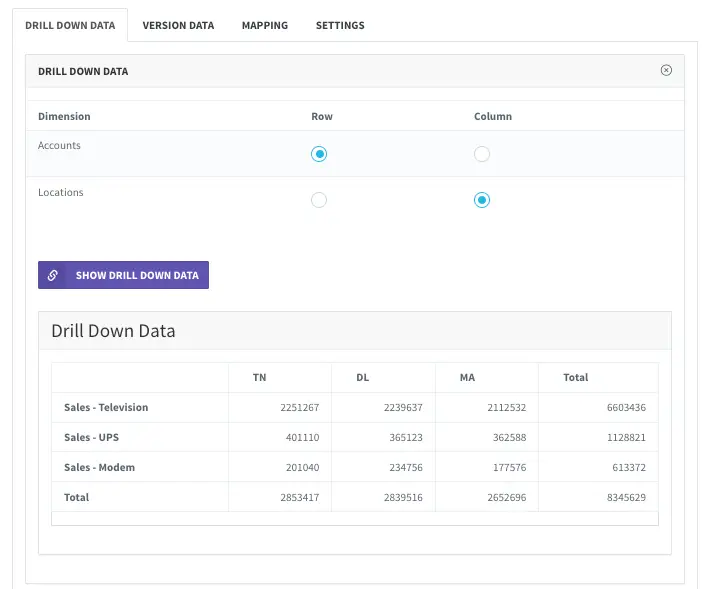
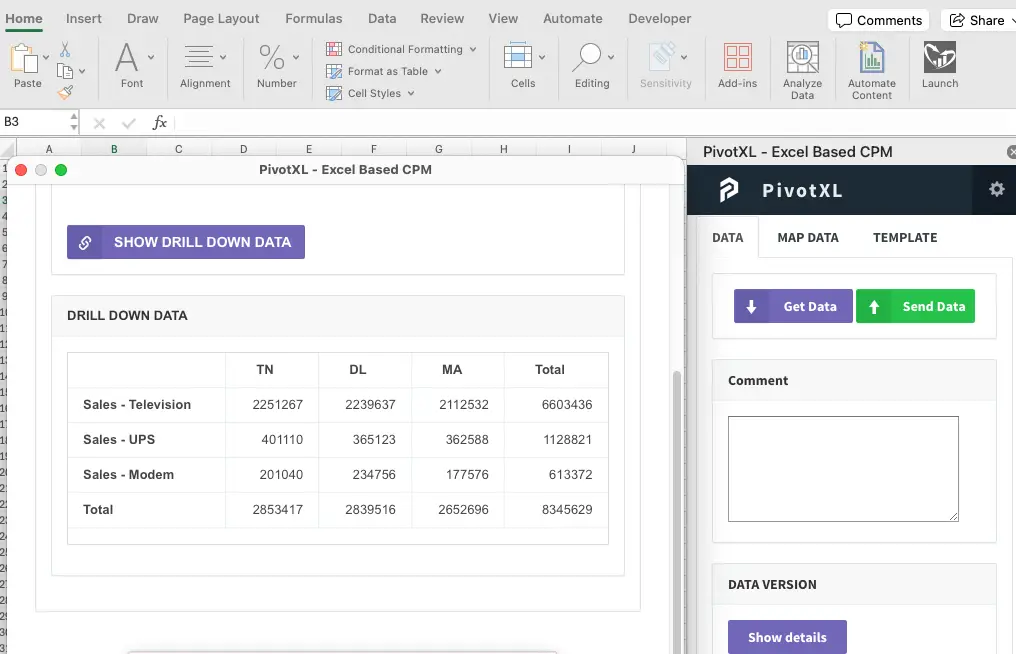
Meanwhile, the Excel add-in provides powerful drill-down capabilities directly within familiar spreadsheet workflows. This integration ensures that users can dissect data from high-level overviews to individual transactions without leaving their preferred tools, enabling faster and more informed decision-making.
In summary, roll-ups and drill-downs add agility to MIS reporting, making it possible to see both the big picture and finer details. This helps decision-makers move from insight to action with confidence. With tools like PivotXL, you gain the power to define and visualize roll-ups and drill-downs effortlessly—empowering you to make data-driven decisions faster and smarter.


