Today, the world of databases is crowded with concepts like SQL (MySQL, PostgreSQL), NoSQL, data lakes, and data warehouses. In this complex ecosystem, simple yet powerful tools like data cubes (or Cube) can often get overshadowed.
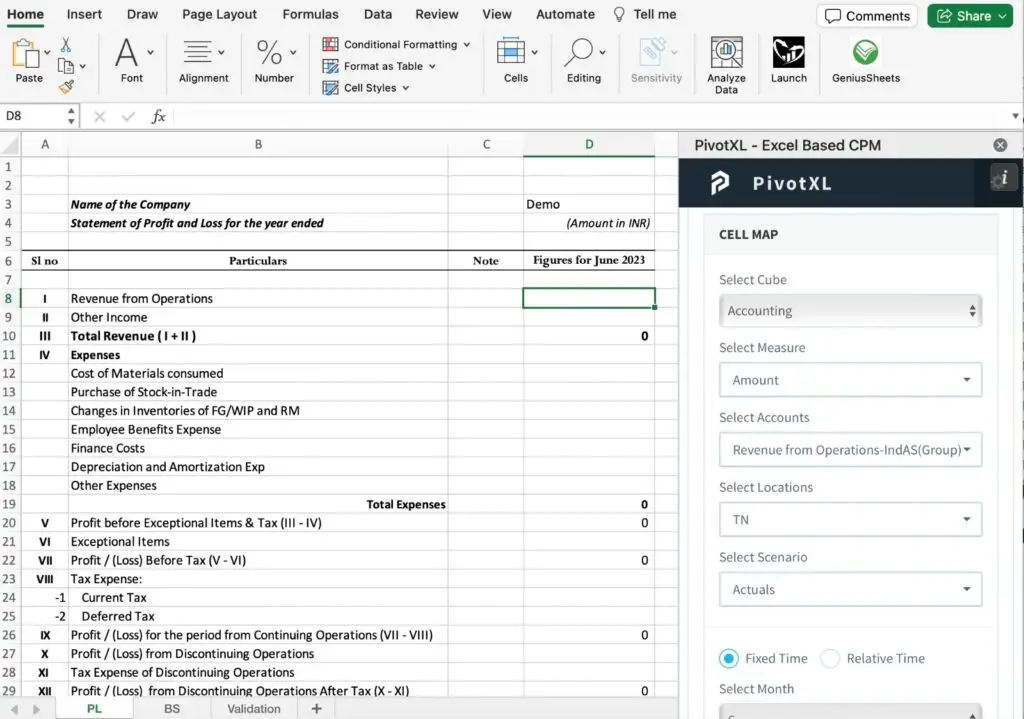
A data cube, once considered a type of database, is now best understood as a straightforward way to store and retrieve financial data in a user-friendly format. Cubes are highly compatible with tools like Excel, making it easy to transform data into tables, charts, and insights.
Despite the rise of newer technologies, cubes remain crucial for finance in 2025. Here’s why:
1. Data Cubes Simplify Multidimensional Financial Analysis
Cubes help finance teams analyze information across multiple dimensions, such as:
- Time (e.g., monthly, quarterly, yearly trends)
- Scenario (e.g., budget vs actuals)
- Products (e.g., revenue by product line)
This ability to “slice and dice” data enables granular insights. For example, teams can quickly drill down from total annual revenue to see how specific products performed in particular regions during a given month.
2. Data Cubes are useful in FP&A
Cubes are integral to financial planning and analysis (FP&A) tasks like:
- Comparing actuals versus budgets
- Running variance analyses
- Creating rolling forecasts
Cubes, when paired with tools like PivotXL, offer a robust framework for scenario planning and strategic decision-making.
3. Integration with Modern Technologies
When paired with tools like PivotXL, data cubes offer seamless integration with Excel, allowing users to easily extract, share, and analyze data. This streamlined process makes it incredibly simple to perform essential financial tasks such as reporting, budgeting, and forecasting, enhancing efficiency and accuracy in financial workflows.

4. Streamlining Financial Reporting with Roll-Ups
Cubes enable advanced calculations like roll-ups, which are crucial in finance for transforming detailed data into meaningful summaries. Roll-ups streamline the preparation of key reports, such as income statements and balance sheets, by automatically aggregating individual accounts—like sales, expenses, and assets—into broader categories such as total revenue, operating expenses, or current assets. This automation not only accelerates the reporting process but also ensures accuracy, significantly reducing the risk of human error in managing complex financial data.
Another major advantage of roll-ups is their ability to handle real-time updates seamlessly. When changes occur in the underlying data, such as adjustments in a trial balance or new entries, roll-ups automatically update the consolidated reports to reflect these changes. This ensures that financial statements remain accurate and up-to-date without manual intervention. By leveraging roll-ups, finance teams can redirect their focus toward strategic analysis and decision-making, enhancing overall productivity and efficiency.
5. Enhanced Financial Insights with Drill-Downs
Drill-downs in data cubes empower finance teams to move beyond high-level summaries and explore detailed insights with ease. By allowing users to “drill down” into specific data points, such as individual accounts, regions, or time periods, this feature makes it simple to investigate the underlying factors driving financial trends.
For example, a drill-down can break down an “Operating Expenses” category on an income statement into specific components like salaries, utilities, and rent, providing clarity on cost drivers. This capability is invaluable for identifying anomalies, addressing variances, or conducting detailed performance reviews. With tools like PivotXL, drill-downs become even more powerful, offering intuitive navigation and real-time data access. This functionality ensures that finance professionals can make data-driven decisions quickly, enhancing both strategic planning and operational efficiency.
6. Advanced YTD and YTG Calculations with Data Cubes
Data cubes, while inherently powerful for multidimensional analysis, can be further enhanced with applications like PivotXL to support advanced calculations such as Year-to-Date (YTD) and Year-to-Go (YTG). These metrics are not natively built into cubes but can be configured through specialized dimensions within tools like PivotXL, allowing for greater flexibility in financial reporting and analysis.
One of the standout features is the ability to define custom start and closing months, which is particularly useful for organizations operating on non-standard fiscal calendars. This configuration enables precise tracking of YTD performance and YTG projections tailored to specific reporting periods. By leveraging these advanced configurations, finance teams can generate more accurate forecasts, monitor progress against annual goals, and make informed decisions throughout the fiscal year. This seamless integration of YTD and YTG calculations elevates the utility of data cubes in dynamic financial environments.
Final Thoughts
While data cubes may seem like an outdated concept from the 1970s, they continue to play a vital role in financial analysis, reporting, and budgeting. Their simplicity and efficiency provide organizations with an effective way to store critical financial data and analyze it across key dimensions like time, geography, and product lines.
Data cubes remain highly relevant for modern financial workflows, offering a straightforward yet powerful framework for addressing essential use cases. They enable businesses to focus on insights and decision-making while ensuring data accuracy and accessibility in a rapidly evolving financial environment.


